Image
Figure Caption
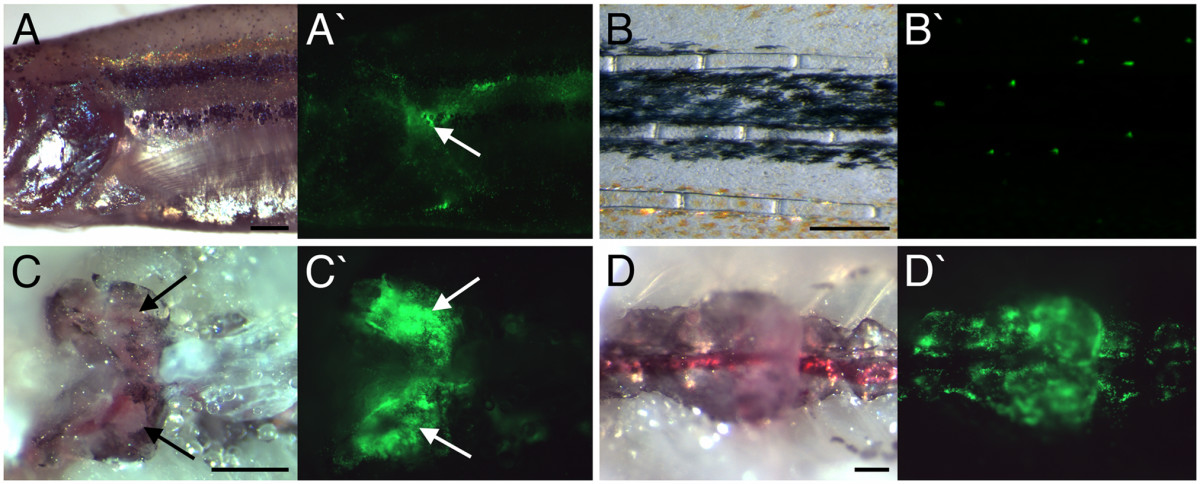
Fig. 2 EGFP expression within adult lysC::EGFP transgenic animals. (A) Lateral view of pectoral fin region. (B) Lateral view of tail fin. (C) Ventral view of dissected head kidney. (D) Ventral view of dissected posterior kidney. Anterior to left in all views. (A-D and A′-D′) Bright field and dark field views, respectively. Arrows mark EGFP-expressing cells within the lobes of the head kidney. Scale bars: 500 μm in A, C and D; 250 μm in B.
Acknowledgments
This image is the copyrighted work of the attributed author or publisher, and
ZFIN has permission only to display this image to its users.
Additional permissions should be obtained from the applicable author or publisher of the image.
Full text @ BMC Dev. Biol.

