
Fig. S4
- ID
- ZDB-IMAGE-071102-21
- Publication
- Hadzhiev et al., 2007 - Hedgehog signaling patterns the outgrowth of unpaired skeletal appendages in zebrafish
- All Figures
- Figures for Hadzhiev et al., 2007
|
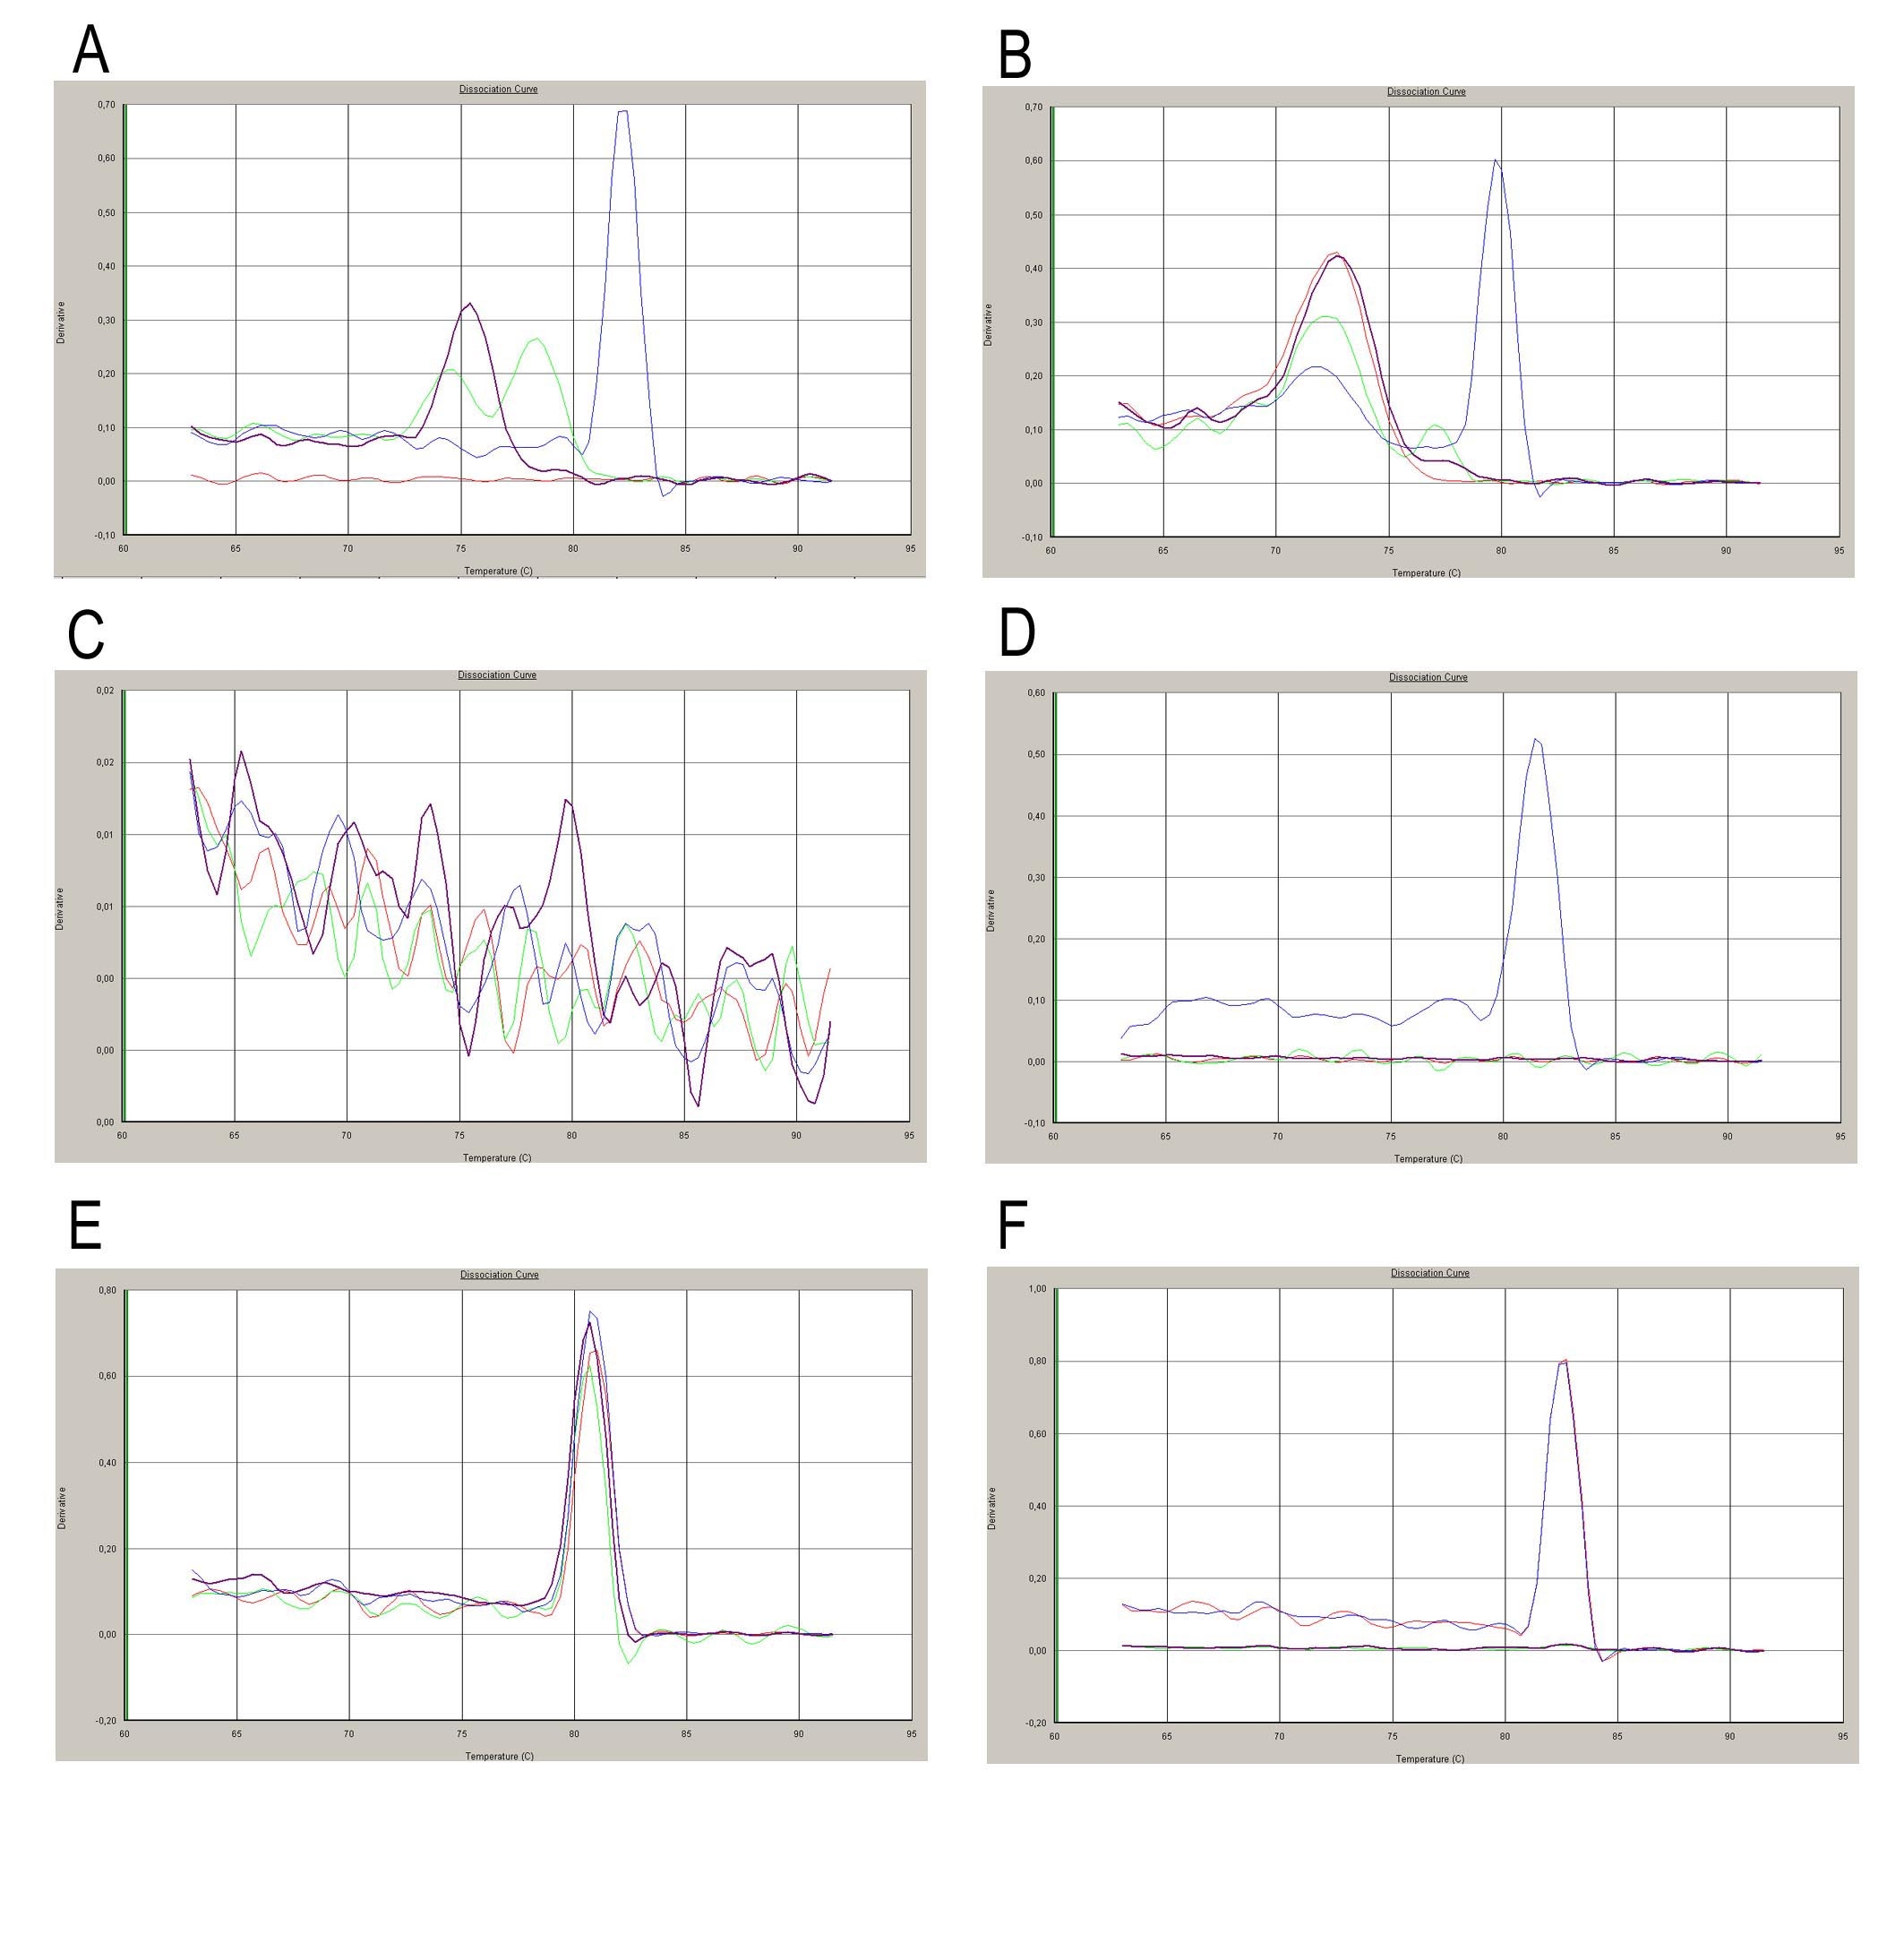
Fig. S4 Dissociation curves of the products from the RT-PCR shown on Fig 3J. The red and blue curves represent the dissociation of the products from ACFP and DFF samples respectively. The green and purple curves show the dissociation of the non-template (primer) controls. Specific products of shh shhb and ihhb (panel A, B and D) have been detected only in the DFF samples, but not in the ACFP. The presence of ihha (panel C) was not detectable either in the ACFP or in the DFF samples. The presence of gfp and beta-actin (panel E and F, respectively) were detectable in both, ACFP and DDF samples. In case of gfp, dissociation curves of the primer controls are very similar to that of the PCR product, due to primer dimmers, however no amplification was observed on the amplification plots (data not shown).