
Fig. 2
- ID
- ZDB-IMAGE-071019-42
- Publication
- Warga et al., 2007 - A role for N-cadherin in mesodermal morphogenesis during gastrulation
- All Figures
- Figures for Warga et al., 2007
|
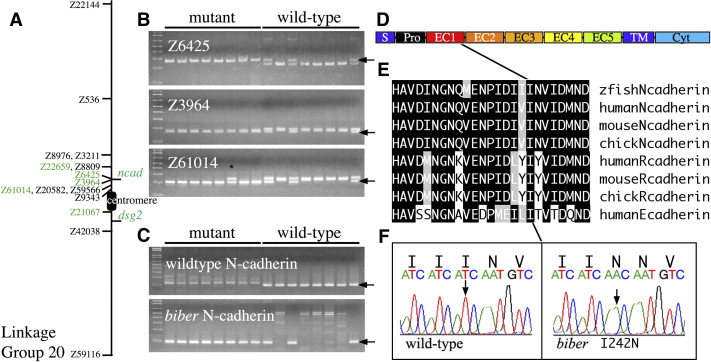
Fig. 2 Identification of bib as N-cadherin. (A) Genetic map of Linkage Group 20. Shown are the positions of microsatellite (Z) markers used in mapping and the genes N-cadherin (ncad) and desmoglein2 (dsg2). Markers in green were used to calculate recombination frequencies in Table 1. (B) Examples of products obtained for three closely linked markers. Arrows indicate product that segregates with mutant allele; black asterisk denotes a homozygous mutant individual possessing both products indicating a recombination event between the marker and the N-cadherin locus. (C) Products obtained from same embryos shown in panel B using the wild-type or mutant N-cadherin-specific primers. The expected product (arrow) is 200 bp. (D) Domain structure of the N-cadherin protein. Cyt, cytoplasmic domain; EC1–5, extracellular domains; Pro, prodomain; S, signal sequence; TM, transmembrane domain. (E) The zebrafish amino acid sequence for the carboxyl-end of EC1 containing the bib mutation and the corresponding amino acid sequence alignments for human, mouse and chick and more distantly related cadherins. Identical residues, black; conserved residues, grey. (F) Sequence trace data showing site of mutation.
Reprinted from Developmental Biology, 310(2), Warga, R.M., and Kane, D.A., A role for N-cadherin in mesodermal morphogenesis during gastrulation, 211-225, Copyright (2007) with permission from Elsevier. Full text @ Dev. Biol.