
Image
|
Figure Caption
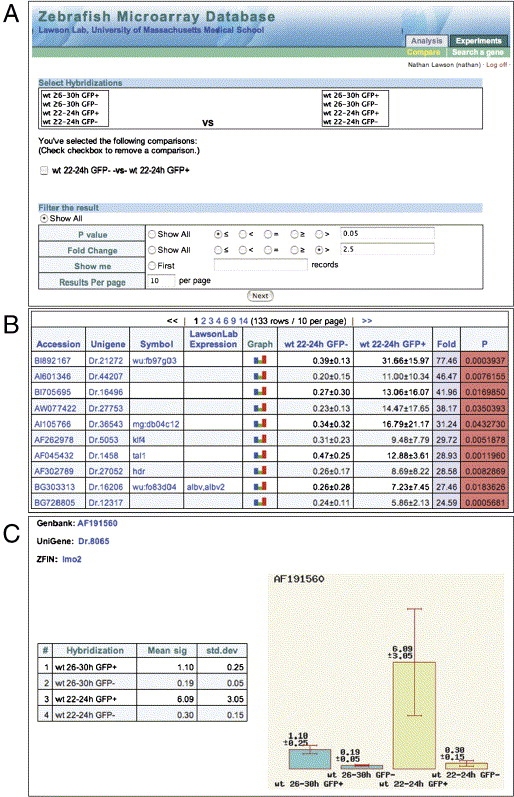
Fig. 8 A Zebrafish microarray database. (A) Opening page of database with possible pairwise combinations and user defined analysis. (B) Results output page showing accession number, gene name, Unigene and values from selected microarray experiment. Also includes links to in situ data. (C) Example of and individual gene page with values across all available microarray data.
Acknowledgments
This image is the copyrighted work of the attributed author or publisher, and
ZFIN has permission only to display this image to its users.
Additional permissions should be obtained from the applicable author or publisher of the image.
Reprinted from Developmental Biology, 299(2), Covassin, L., Amigo, J.D., Suzuki, K., Teplyuk, V., Straubhaar, J., and Lawson, N.D., Global analysis of hematopoietic and vascular endothelial gene expression by tissue specific microarray profiling in zebrafish, 551-562, Copyright (2006) with permission from Elsevier. Full text @ Dev. Biol.