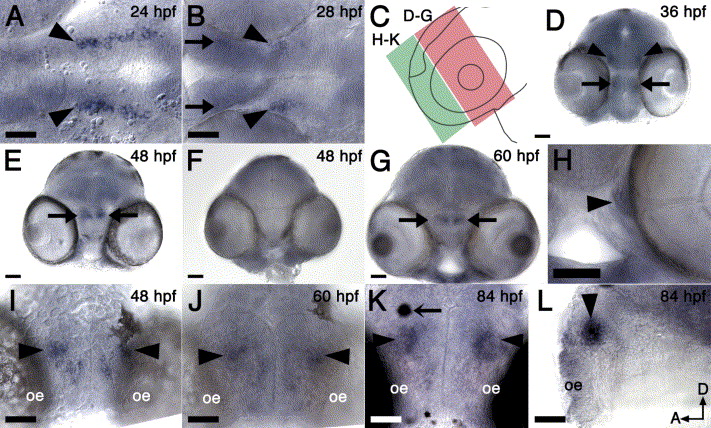
Fig. 3 Expression of sema3G in the brain. (A and B) Ventral views of midbrain region in 24 hpf (A) and 28 hpf (B) embryos showing sema3G expression in bilateral clusters in the ventral midbrain (arrowheads). At 28 hpf, bilateral expression is also seen in the diencephalon (arrows in B). (C) Diagram showing relative positions of thick cross-sections of the midbrain regions (red, D–G) and telencephalon (green, H–K). (D) Cross section through midbrain at 36 hpf shows sema3G is expressed in the ventral midbrain (arrowheads) and diencephalon (arrows). (E–H) Sections at 48 hpf (E–F) and 60 hpf (G–H). (E) sema3G is expressed in the diencephalon (arrows), with diffuse expression in the ventral midbrain. (F) Staining with a sense probe to sema3G does not show this expression. (G) sema3G still is expressed in the diencephalon at 60 hpf (arrows). (H) At 60 hpf sema3G is expressed in the region of the optic nerve head (arrowhead). (I–K) Anterior views at 48 hpf (I), 60 hpf (J) and 84 hpf (K) shows expression in the telencephalon has formed a distinct bilateral pattern, with strongly expressing cells (arrowheads) dorsomedial to the olfactory epithelium (oe). The arrow in (K) indicates a melanocyte. (L) Sagittal section at 84 hpf shows that sema3G is expressed in close proximity to the olfactory epithelium. Anterior is to the left and dorsal is up. The eye was removed to facilitate viewing. Scale bars=50 μm.
Reprinted from Gene expression patterns : GEP, 5(5), Stevens, C.B., and Halloran, M.C., Developmental expression of sema3G, a novel zebrafish semaphorin, 647-653, Copyright (2005) with permission from Elsevier. Full text @ Gene Expr. Patterns

