
|
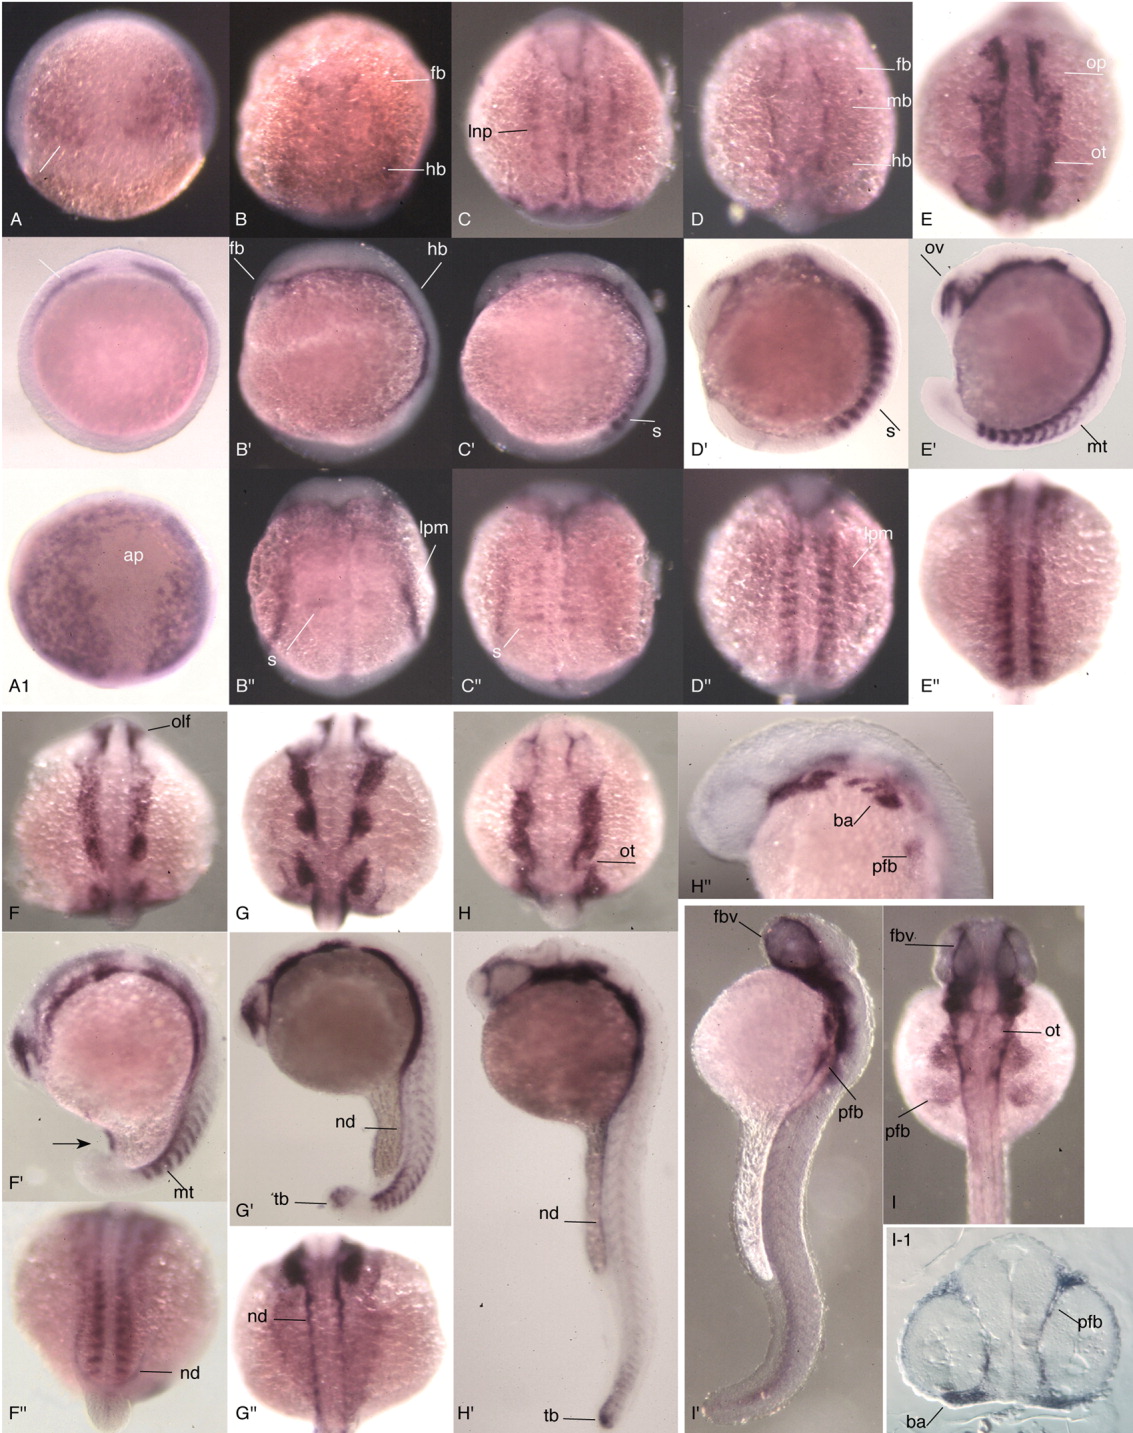
Fig. 4 Embryonic mRNA expression pattern of the zebrafish twist1b gene. All images labeled with the same letter represent the same embryo in different views, except A1, which is slightly older than the embryos in A and A′. All images are oriented with rostral at the top; in all lateral views anterior is to the left. Embryos shown are at the following stages: A, late shield; A1, ∼8hpf; B, 1-2 somites; C, 5-6 somites; D, 10 somites; E, 12 somites; F, 15 somites; G, 24 somites; H, 30 hpf; I, 36 hpf. A, A1: Dorsal view; A′: animal pole view; B-I: dorsal veiw of the head region; B′-I′: lateral view of the body; B″-I″: dorsal view of the body; H″: tilted profile view to better show the branchial arches. ap, animal pole area; ba, branchial and pharyngeal arches; cfb, chb, cmb, neural crest of the fore-, hind-, and midbrain areas; fb, forebrain; fbv, forebrain blood vessels; hb, hindbrain; lpm, lateral plate mesoderm; lnp, lateral neural plate; mb, midbrain; mt, myotome; nd, nephric duct; olf, olfactory placode; op, optic vesicle; ot, otic vesicle; pfb, pectoral fin bud primordia; s, somite; tb, tail bud area; arrow, signal in the area of the future ventral gut.