
Fig. 1
- ID
- ZDB-IMAGE-070823-30
- Publication
- Dickmeis et al., 2007 - Glucocorticoids Play a Key Role in Circadian Cell Cycle Rhythms
- All Figures
- Figures for Dickmeis et al., 2007
|
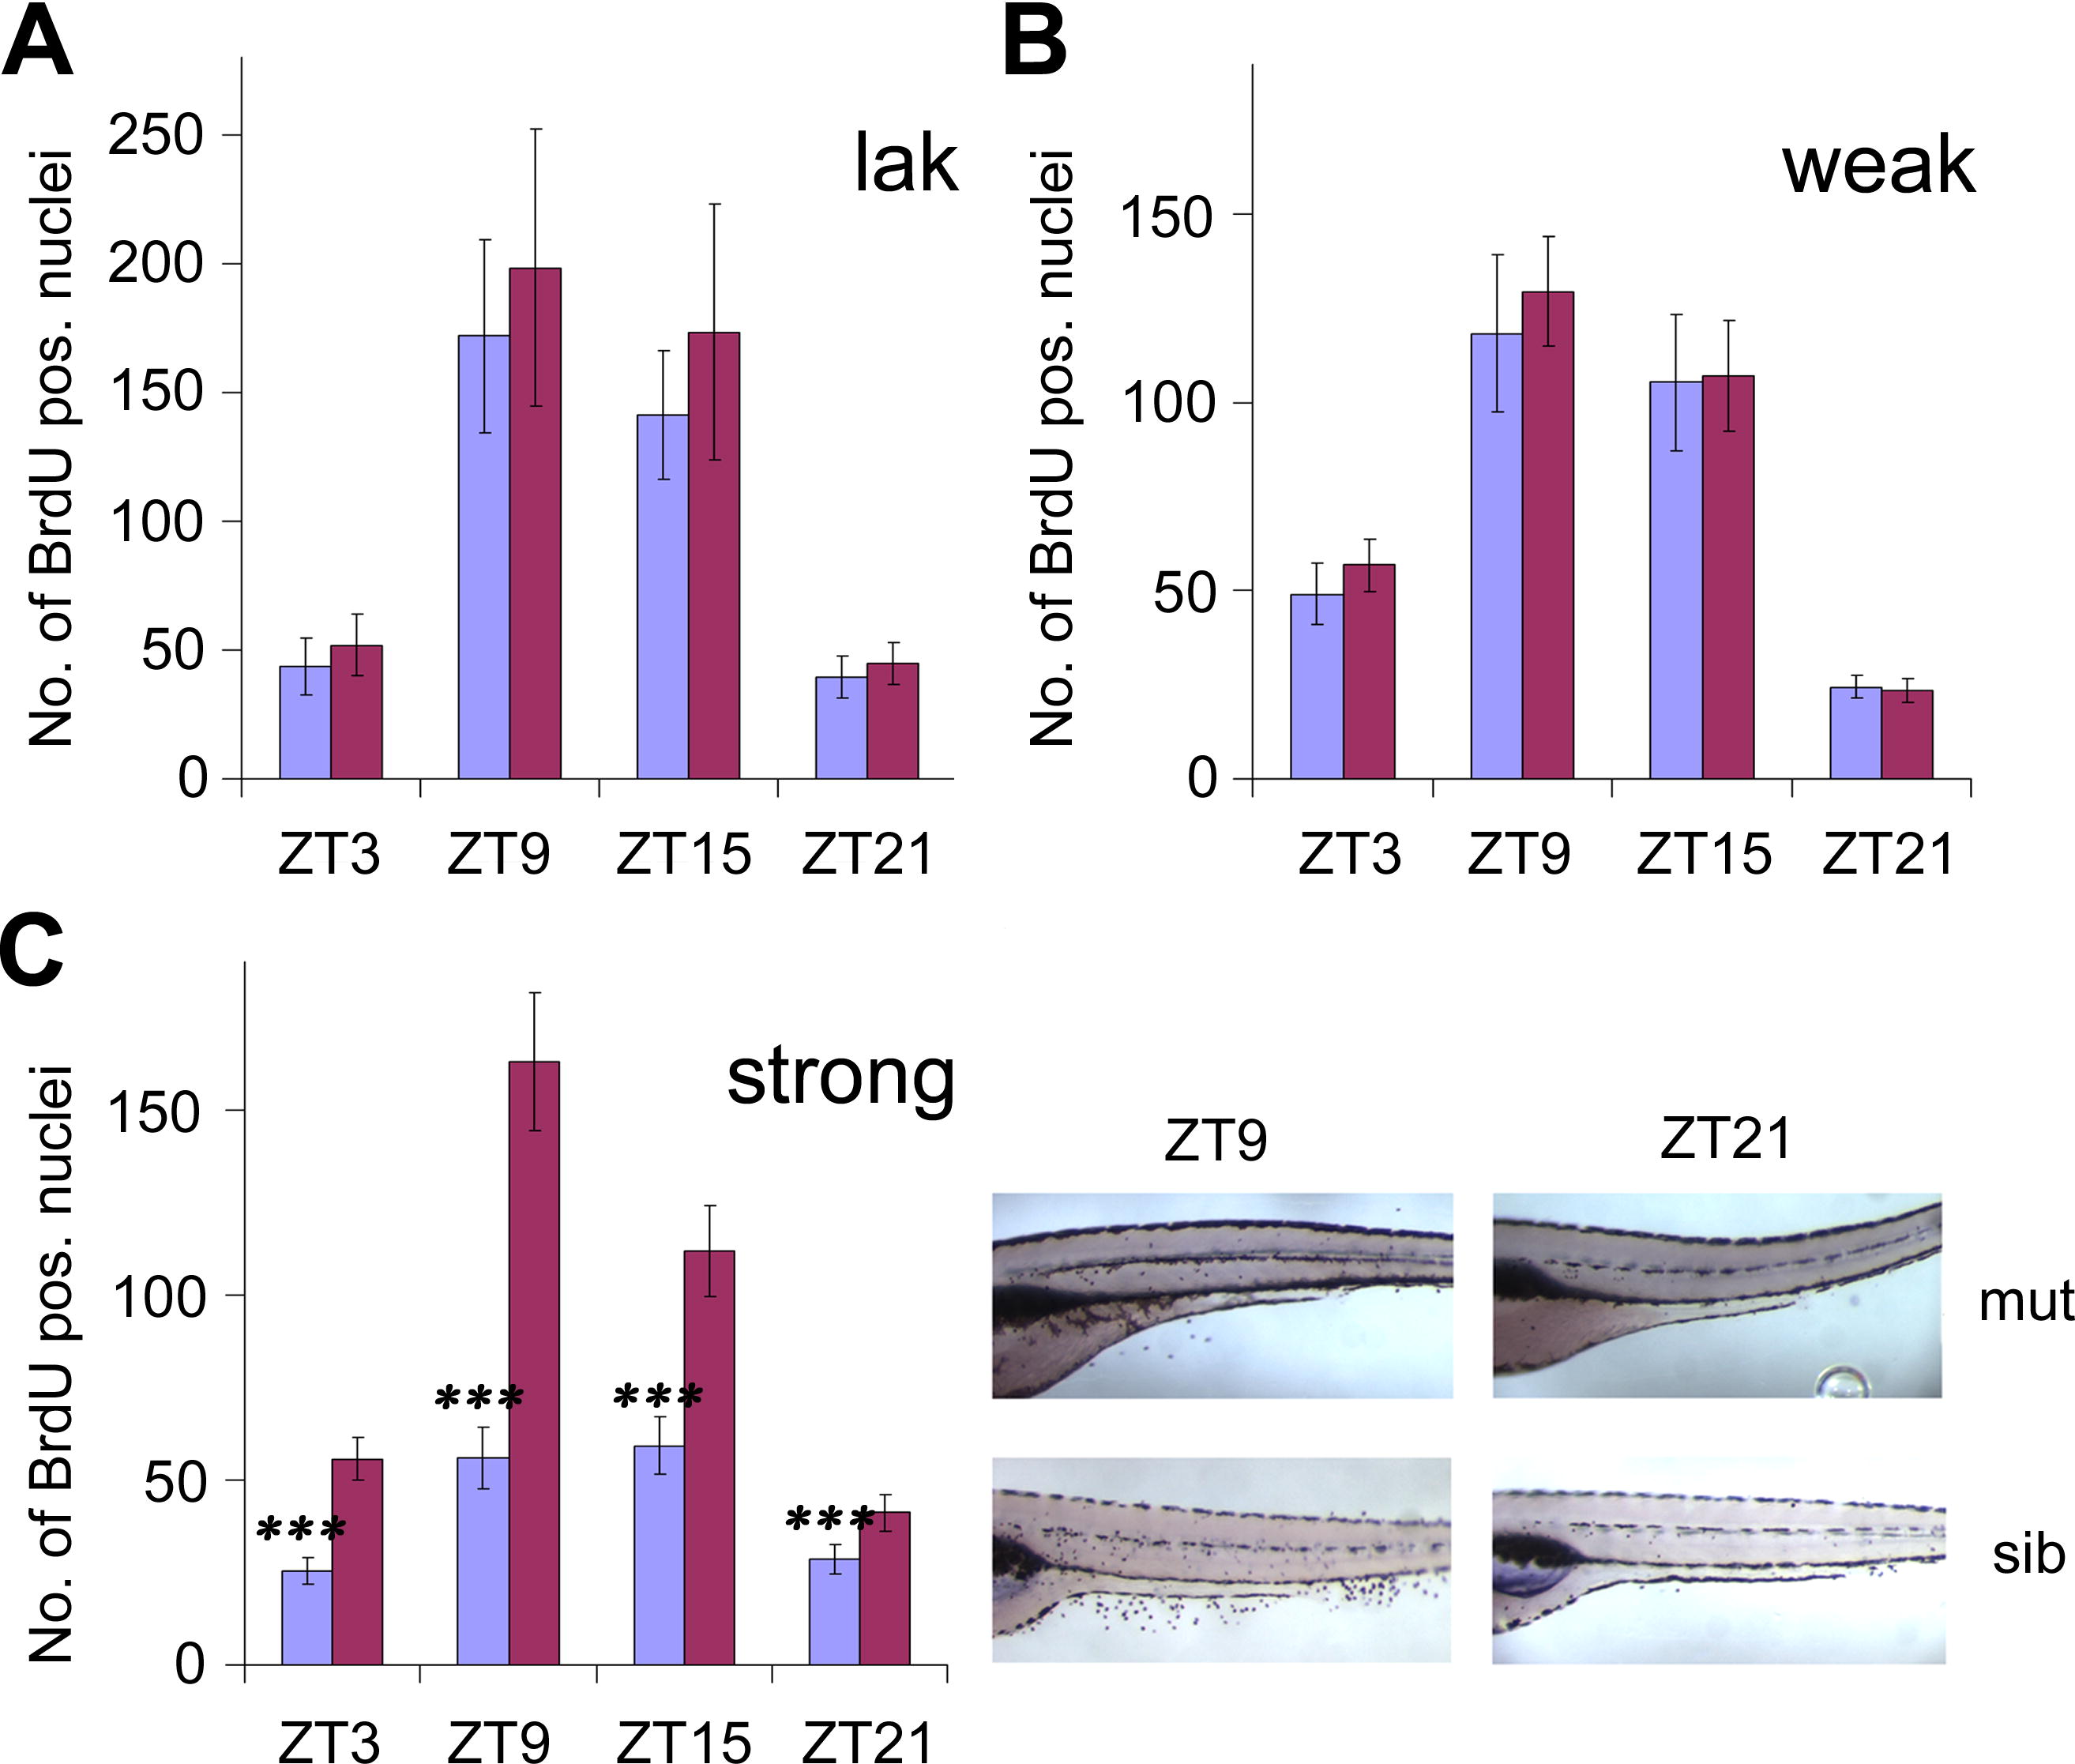
Fig. 1 Circadian Cell Cycle Rhythms in Blind Zebrafish Mutants (A) Quantification of BrdU-labeled nuclei in lak mutant larvae and wild-type siblings at four circadian time points. The mean number of positive nuclei between swim bladder and anus (y axis) was plotted against ZT, hours after lights on, lights off at ZT12) (x axis) for mutant (blue) and sibling (red) larvae. Error bars indicate the 95% confidence interval for the mean, and asterisks indicate the statistical significance of differences between mutants and wild-type siblings as measured by the Mann-Whitney-Test. ***, p < 0.001. (B) Quantification of BrdU incorporation analogous to (A) for mutants and siblings of the weak rx3 allele. (C) Left: quantification analogous to (A) for strong rx3 mutants. Right: representative examples of whole-mount stainings used for the quantification. Mutant (mut) and sibling (sib) larvae at peak (ZT9) and trough (ZT21) points of the cell cycle rhythm are shown. Mutant larvae appear darker, because their melanophores are expanded (lack of visual background adaptation in blind fish). A high-resolution image of this part of the figure is provided as Figure S1. Pooled results from two (A), four (B), and nine (C) independent experiments are shown.