
|
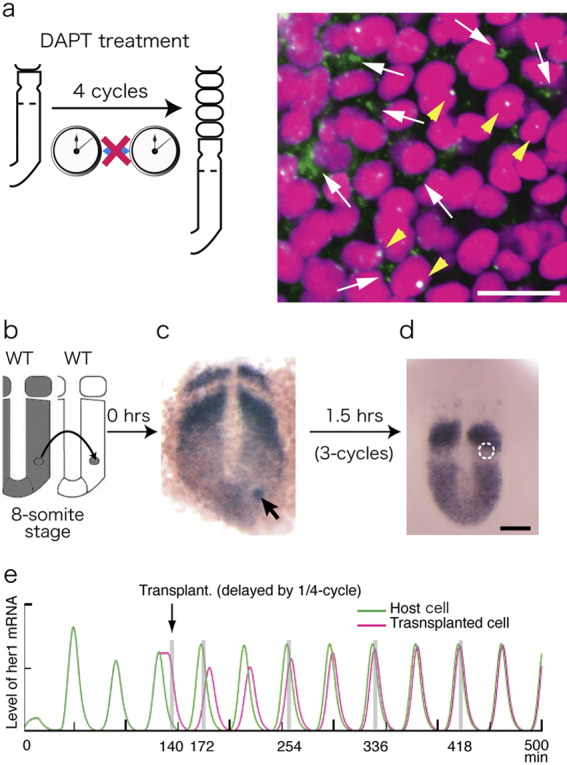
Fig. 3 Notch-dependent phase synchronization. a: Disrupted synchrony in 10-somite-stage embryos transiently treated with DAPT for 2 hr. A large number of cells go out of phase, showing both delayed (arrows) and advanced (arrowheads) phases, in the synchronized zone of the posterior PSM (compare with 1d1-3 in the normal PSM). Scale bar = 20 μm. b-d: Wild-type cells of the posterior PSM were directly transplanted into normal embryos at the same axial level. her1 expression is shown (purple) in these embryos just after transplantation (arrow in c) and at 1.5 hr later (d). Donor cells in d are encircled with white dots. Scale bar = 50 μm. e: Interaction between two oscillating groups calculated by 1-D simulation. A cell with a delayed phase (1/4-cycle) is transplanted at t = 140 min (arrow). The phase of the explants is gradually synchronized to that of the host over several rounds of oscillation. The levels of her1 mRNA in the host (green) and explant cells (magenta) are traced as a function of time. For details, see Horikawa et al. ([2006]).