
Fig. S2
- ID
- ZDB-IMAGE-070418-22
- Genes
- Publication
- Voas et al., 2007 - alphaII-Spectrin Is Essential for Assembly of the Nodes of Ranvier in Myelinated Axons
- All Figures
- Figures for Voas et al., 2007
|
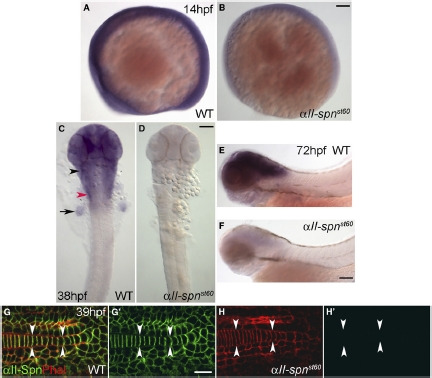
Fig. S2 Expression of αII-spectrin mRNA and Protein during Development (A–F) RNA in situ hybridization detecting αII-spn transcripts in the wild-type (A, C, and E) and αII-spnst60 mutant zebrafish (B, D, and F) at 14 hpf (A and B), 38 hpf (C and D), and 72 hpf (E and F). (A), (B), (E), and (F) show lateral views with anterior left and dorsal up. (C) and (D) show dorsal views with anterior up. In the wild-type, expression of αII-spn is initially ubiquitous (A) but later becomes especially prominent in the brain, eyes, and cranial ganglia (C and E). The black arrowhead in (C) indicates the region of the anterior lateral line and trigeminal ganglia, whereas the red arrowhead indicates the region of the PLL ganglion and the arrow points to the fin bud. Expression of αII-spn is greatly reduced in αII-spnst60 mutants as early as 14 hpf (B) and is almost completely absent in later stages (D and F). Scale bars represent 100 μm. (G–H) High magnification views of embryonic tails (anterior left, dorsal up, arrowheads indicate the notochord) labeled with phalloidin (red) and anti-αII-spectrin (green) at 39 hpf. (G0) and (H0) show anti-αII-spectrin labeling alone. In the wild-type, αII-spectrin is closely associated with the plasma membrane (colocalization with phalloidin in [G]), although expression of αII-spectrin in αII-spnst60 mutants is not detectable at this stage (H′). The scale bar represents 10 μm.