
IMAGE
Fig. 1
- ID
- ZDB-IMAGE-070219-18
- Publication
- Nair et al., 2007 - Requirements for Endothelin type-A receptors and Endothelin-1 signaling in the facial ectoderm for the patterning of skeletogenic neural crest cells in zebrafish
- All Figures
- Figures for Nair et al., 2007
Image
|
Figure Caption
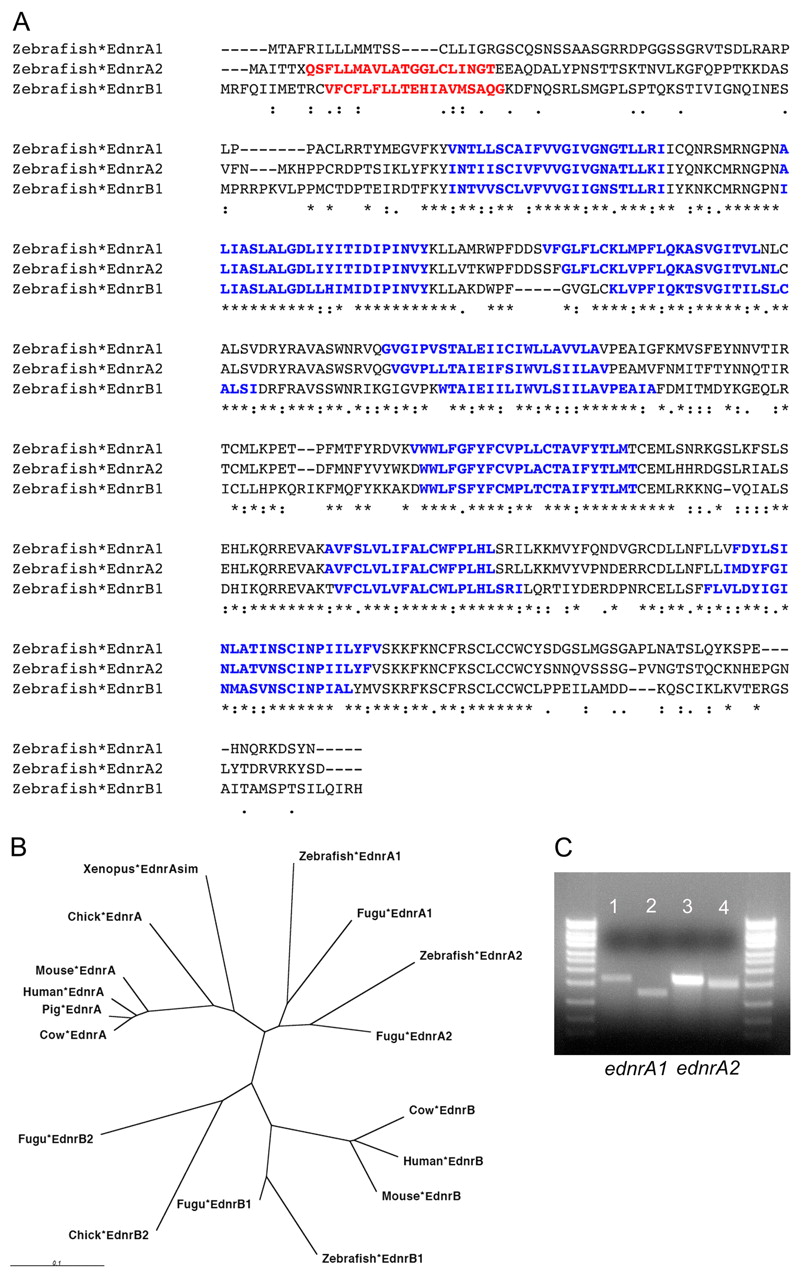
Fig. 1 Characterization of zebrafish Ednras. (A) Alignment of zebrafish Ednras with Ednrb1. (B) The Ednr receptor family in vertebrates. (C) Splicing defects in Ednra morphants. PCR products of 1700 bp are seen in wild types (lane 1 ednra1, lane 3 ednra2), whereas morphants have one smaller product of 900 bp (lane 2, ednra1 MO) and 1500 bp (lane 4, ednra2 MO).
Acknowledgments
This image is the copyrighted work of the attributed author or publisher, and
ZFIN has permission only to display this image to its users.
Additional permissions should be obtained from the applicable author or publisher of the image.
Full text @ Development