
Fig. 6
- ID
- ZDB-IMAGE-061228-3
- Publication
- Zolessi et al., 2006 - Polarization and orientation of retinal ganglion cells in vivo
- All Figures
- Figures for Zolessi et al., 2006
|
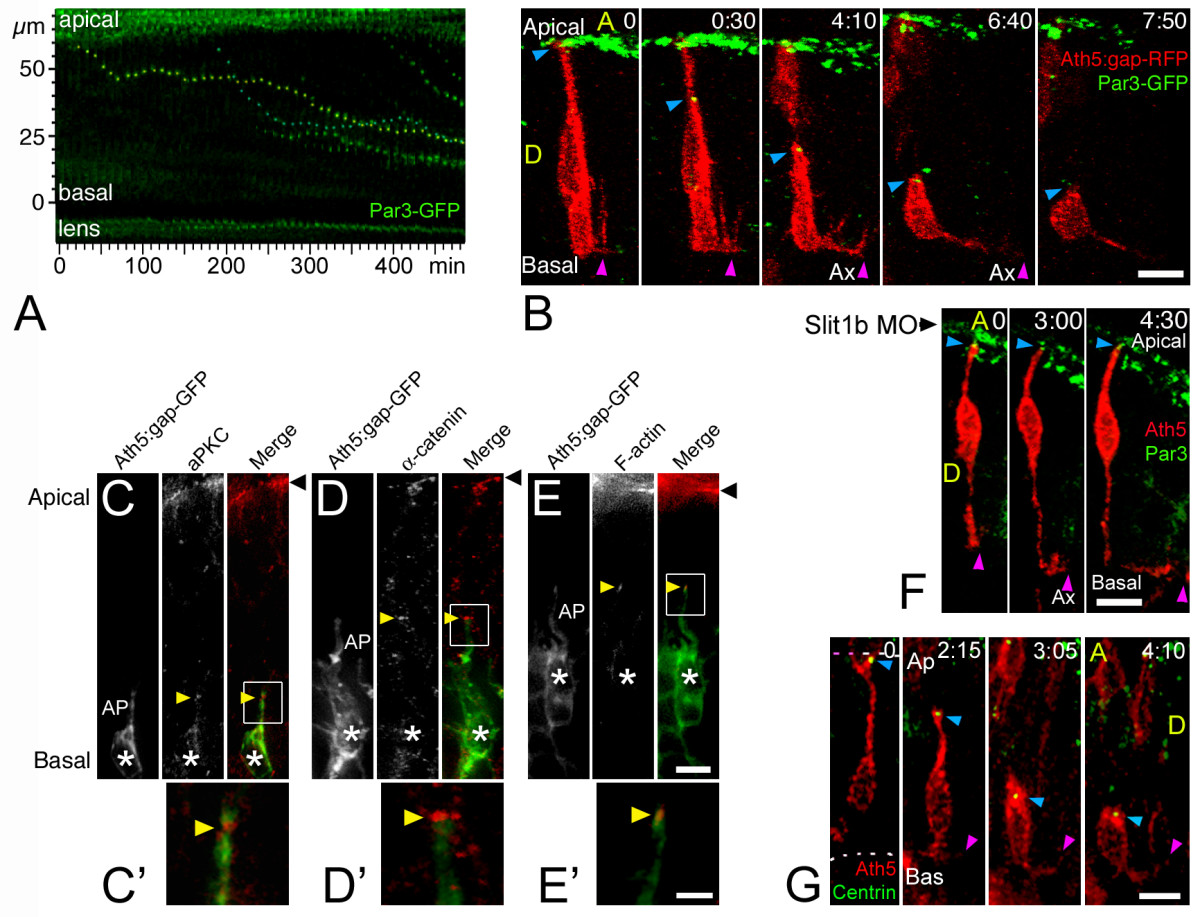
Fig. 6 The apical process of retinal ganglion cells (RGCs) remains with apical identity during axon initiation. (a) Time-series representation of the Par3-GFP-labeled tips of retracting apical processes. Two dots (from contiguous cells) that show a complete movement from their initial (apical) to their final (basal) positions are pseudo-colored in yellow and blue (Additional file 4). The movement of these dots is reminiscent of that of the retraction of the apical processes (see Figure 3). Time point 0 is at 32 hpf. (b) Four-dimensional (4D) analysis of an embryo expressing ath5:gap-rfp (injected as plasmid DNA) and Par3-GFP (injected as mRNA). The blue arrowhead indicates the tip of the apical process of a differentiating RGC undergoing axonogenesis, and the purple arrowhead indicates the axon (Additional file 5). The green signal seen at the top of the images represents the Par3-GFP accumulation at the apical border of retinal neuroepithelial cells and of retinal pigment epithelium cells. Time point 0 is at 32 hpf. Ax, axon; A, anterior, D, dorsal; time is shown in hours:minutes. Scale bar, 10 μm. (c-e) Immunolabeling of ath5:gap-gfp transgenic embryos with different apical markers (anti-aPKC and anti-α-catenin antibodies, and phalloidin-Texas Red to label actin filaments), showing their accumulation (yellow arrowheads) at the tip of retracting apical processes (AP) of RGCs (asterisks). Eight to ten embryos, at different stages, were used in this analysis for each marker, and representative examples are shown. (c,d) 33 hpf; (e) 42 hpf. Black arrowhead: apical border of the neuroepithelium. Scale bars, 5 μm (c-e) and 2 μm (c'-e'). (f) 4D sequence from an ath5:gap-rfp (transgenic) and Par3-GFP (mRNA-injected)-expressing embryo, treated with Slit1b morpholino. Note the formation and elongation of the axon (purple arrowhead) without detachment of the apical process from the apical side of the neuroepithelium (blue arrowhead). Time point 0 is at 40 hpf. Ax, axon; time is shown in hours:minutes. Scale bar, 10 μm. (g) 4D analysis of an embryo expressing ath5:gap-rfp (injected as plasmid DNA) and GFP-zcentrin (injected as mRNA). The blue arrowhead indicates the tip of the apical process of a differentiating RGC, and the purple arrowhead indicates the axon (Additional file 6). Some green background appears in the pictures, which mostly comes from cytoplasmic GFP-zcentrin in cells that express a very high level of the fusion protein (this is not the case in the highlighted cell). That the signal is predominantly centrosomal can be seen better in Additional file 6. Time point 0 is at 32 hpf. Ax, axon; A, anterior, D, dorsal; time is shown in hours:minutes. Scale bar, 8 μm.