
Fig. 2
- ID
- ZDB-IMAGE-061228-2
- Publication
- Zolessi et al., 2006 - Polarization and orientation of retinal ganglion cells in vivo
- All Figures
- Figures for Zolessi et al., 2006
|
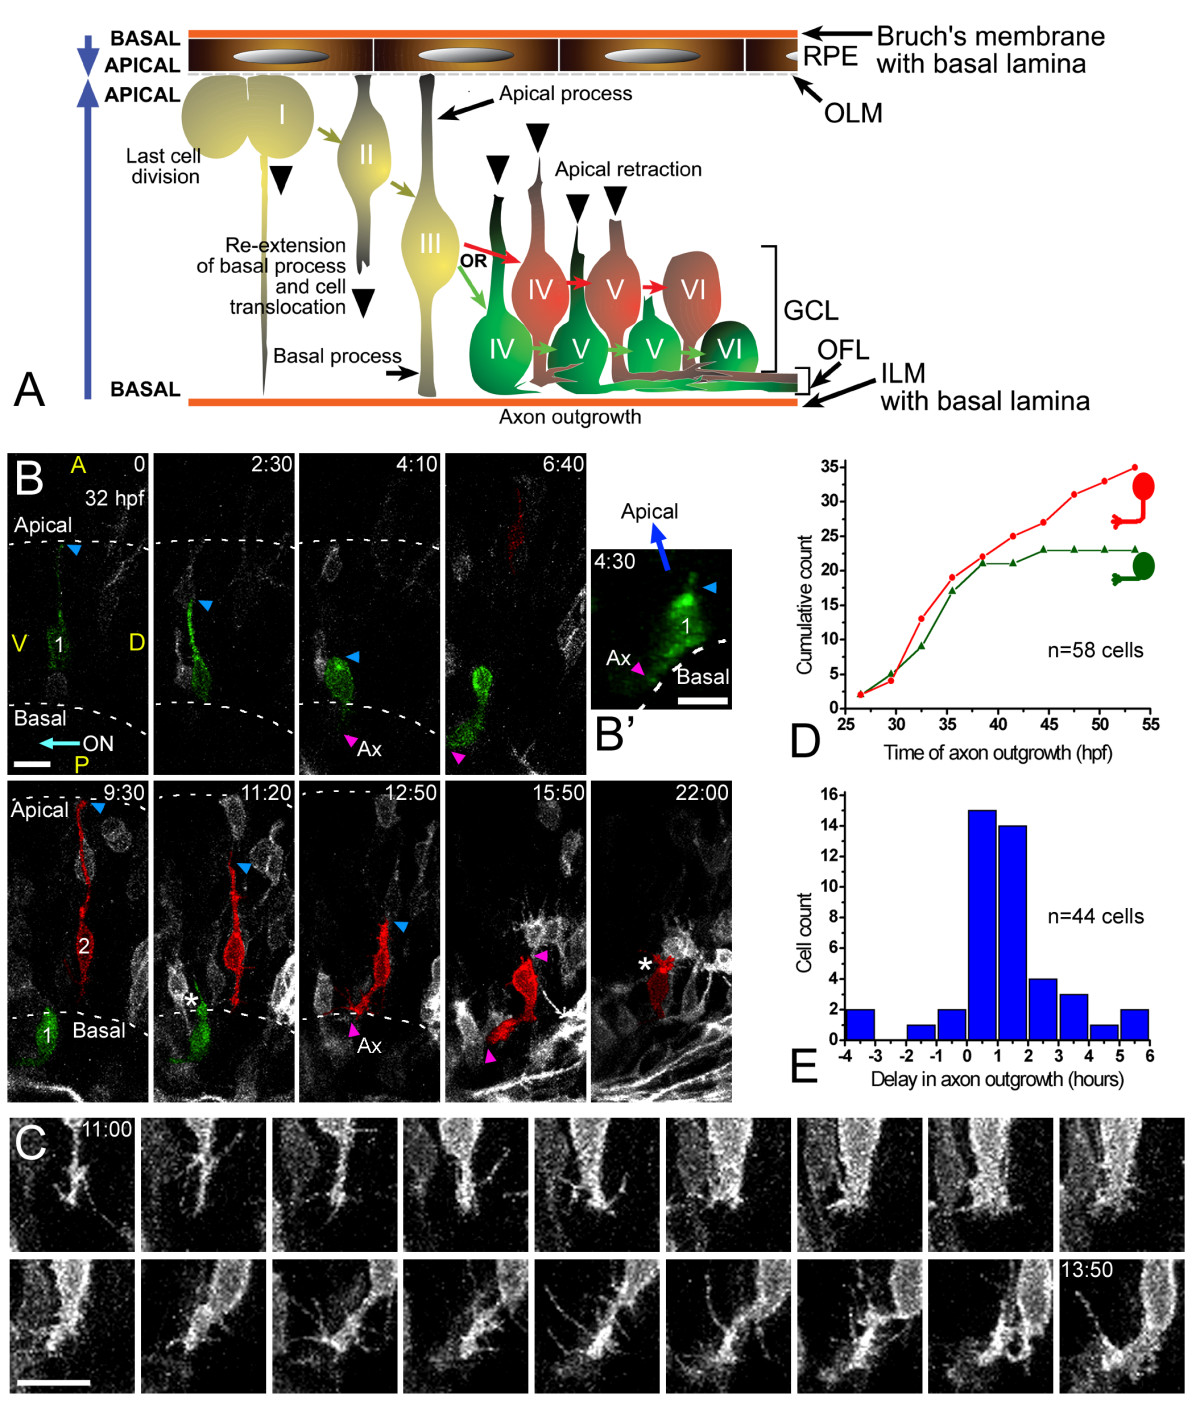
Fig. 2 Retinal ganglion cell (RGC) polarization in vivo seems restricted by the environment. (a) Summary of the observed behaviors of normal RGCs in vivo. GCL, ganglion cell layer; ILM, inner limiting membrane; OFL, optic fiber layer; OLM, outer limiting membrane. (b) Time-lapse confocal (four-dimensional (4D)) analysis of an ath5:gap-gfp-injected embryo, showing two differentiating cells that undergo apical retraction and axonogenesis (Additional file 2). Cell 1 (green) shows no basal process when forming the axon (see view rotated 90° on the y axis in (b')), whereas cell 2 (red) does. Ax, axon; ON, optic nerve; A, anterior, D, dorsal; P, posterior; V, ventral; the asterisk marks cell processes at the apical side of the differentiating RGCs, where the dendrites are forming. The recording was started at 32 hpf; time is shown in hours:minutes. Scale bars, 10 μm. (c) Complete sequence of images from cell 2, with images taken every 10 minutes and showing a detail of the basal cell surface dynamics just before axonogenesis. Scale bar, 10 μm. (d) Cumulative plot showing the time of axon formation for RGCs with (red dots) and without (green triangles) a visible basal process at the moment of forming the axon, from the 4D analyses in vivo. (e) Distribution analysis of the delay between apical retraction and axonogenesis in 44 cells followed by 4D imaging.