
Fig. 1
- ID
- ZDB-IMAGE-061228-1
- Publication
- Zolessi et al., 2006 - Polarization and orientation of retinal ganglion cells in vivo
- All Figures
- Figures for Zolessi et al., 2006
|
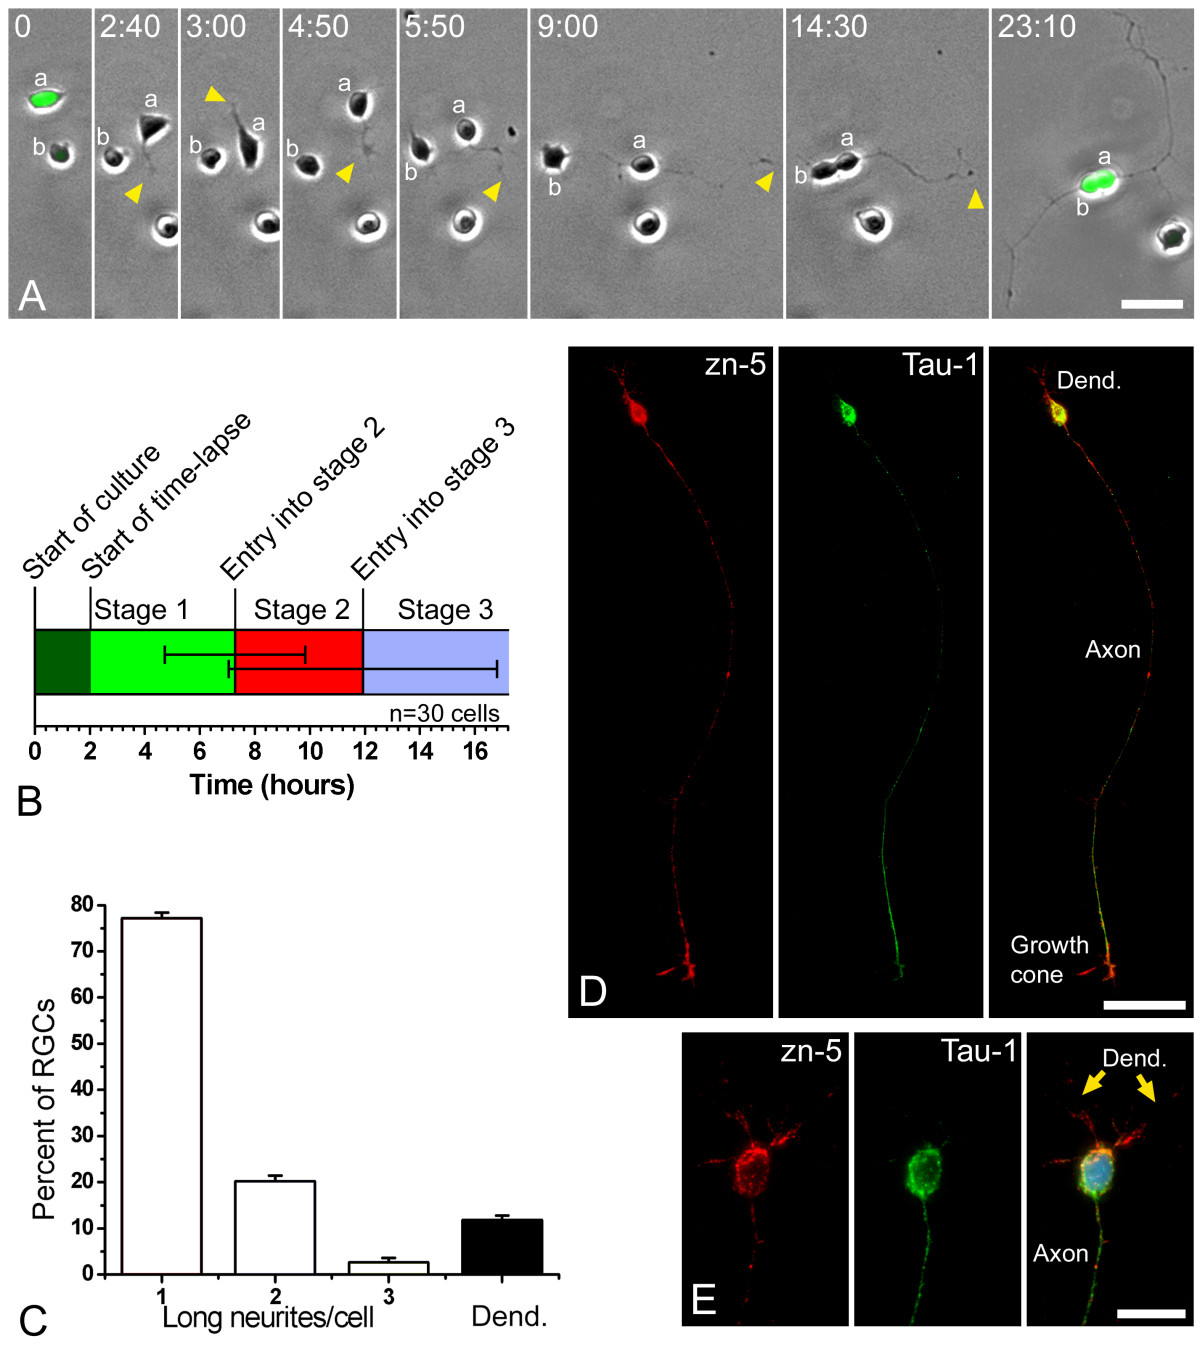
Fig. 1 Retinal ganglion cells (RGCs) polarize in vitro after a period of plastic behavior. (a) Time-lapse analysis of dissociated ath5:gfp-expressing retinal cells in culture (Additional file 1). At the start of the time-lapse, cell 'a' expressed a higher level of GFP and was already in late stage 1 of differentiation (namely forming long filopodia), whereas cell 'b' showed a lower fluorescence and was at early stage 1. A short time later cell 'a' started to generate short processes ('neurites'; arrowheads), indicating the onset of stage 2. One of the neurites formed a growth cone at time point 4 minutes 30 seconds and started to grow faster at the beginning of stage 3. After the cell bodies made contact, near the end of the sequence, cell 'b' also seemed to extend an axon-like neurite. Time is shown in hours:minutes. Scale bar, 15 μm. (b) Graphic representation of the timing of in vitro differentiation of zebrafish RGCs, where 30 cells were followed by time-lapse video microscopy. The horizontal lines in the middle of the bar represent the standard deviation from the transitions between stages 1 and 2 and between stages 2 and 3. (c) Analysis of the morphology of the RGCs (Zn5-positive cells) after 24 hours in culture. n = 100 cells, in three independent cell-culture experiments. 'Long neurites' are longer than three cell diameters. (d, e) Cultured RGCs at stage 4 (24 hours in vitro), labeled with the RGC-specific antibody Zn-5 (red), an anti-Tau-1 antibody (green) and 4',6-diamidino-2-phenylindole in (e). Scale bars, 30 μm (d) and 10 μm (e).