
|
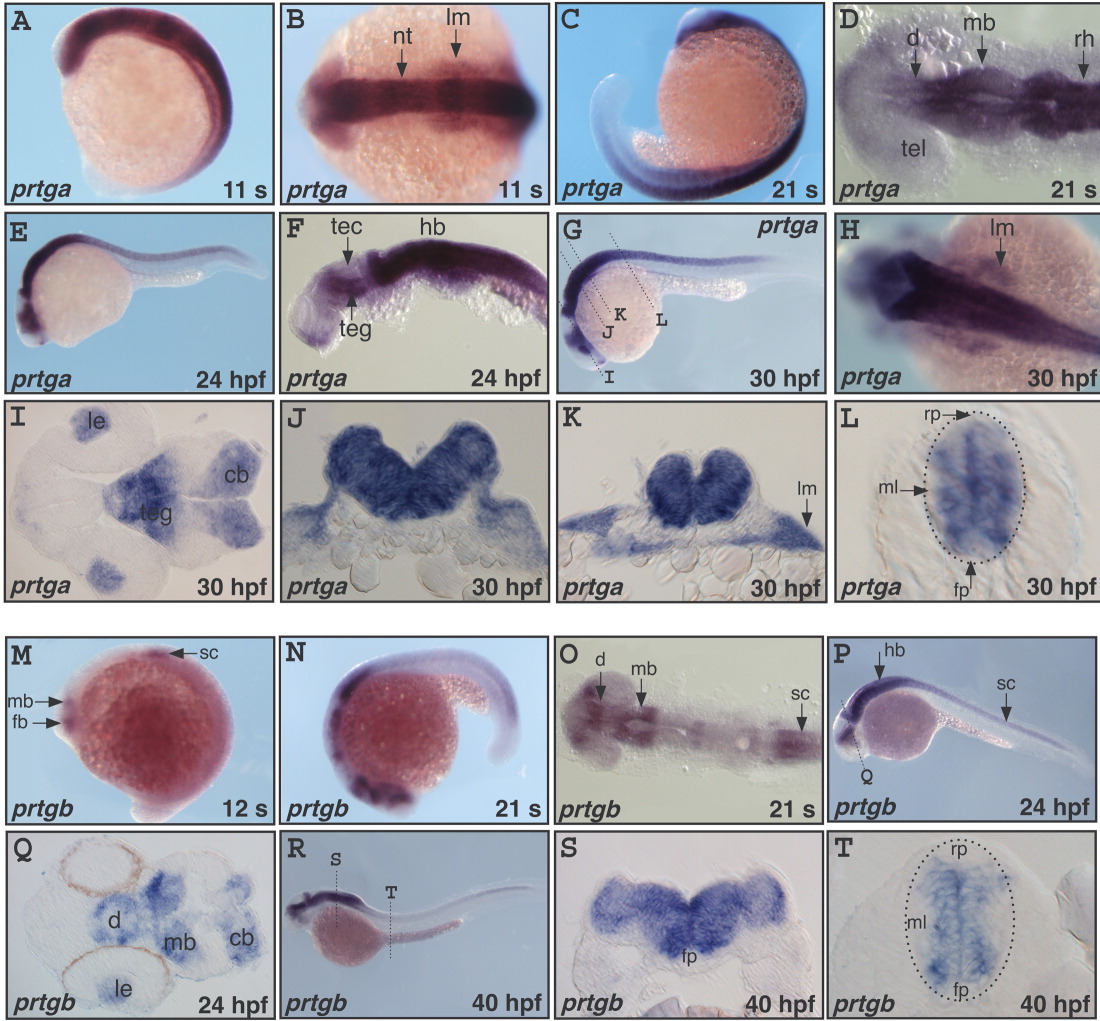
Fig. 4 Expression patterns of the zebrafish prtga and prtgb genes. A-T: In situ hybridization (ISH) performed on zebrafish embryos with antisense prtga (A-L) or prtgb (M-T) probes. The embryonic stages are indicated on each panel, in somites (s) or hours postfertilization (hpf). B and H show dorsal views of whole embryos, A, C, E, G, M, N, P and R, lateral views of whole embryos; D and O, dorsal views of flat-mounted embryos; F, a lateral view of a flat-mounted embryo; I-L, Q, S, and T, sections at levels indicated in G, P and R. Cb, cerebellum; d, diencephalon; fb, forebrain; fp, floor plate; hb, hindbrain; le, lens; lm, lateral mesoderm; mb, midbrain; ml, mantle layer; nt, neural tube; rp, roof plate; sc, spinal cord; tec, tectum; teg, tegmentum.