
|
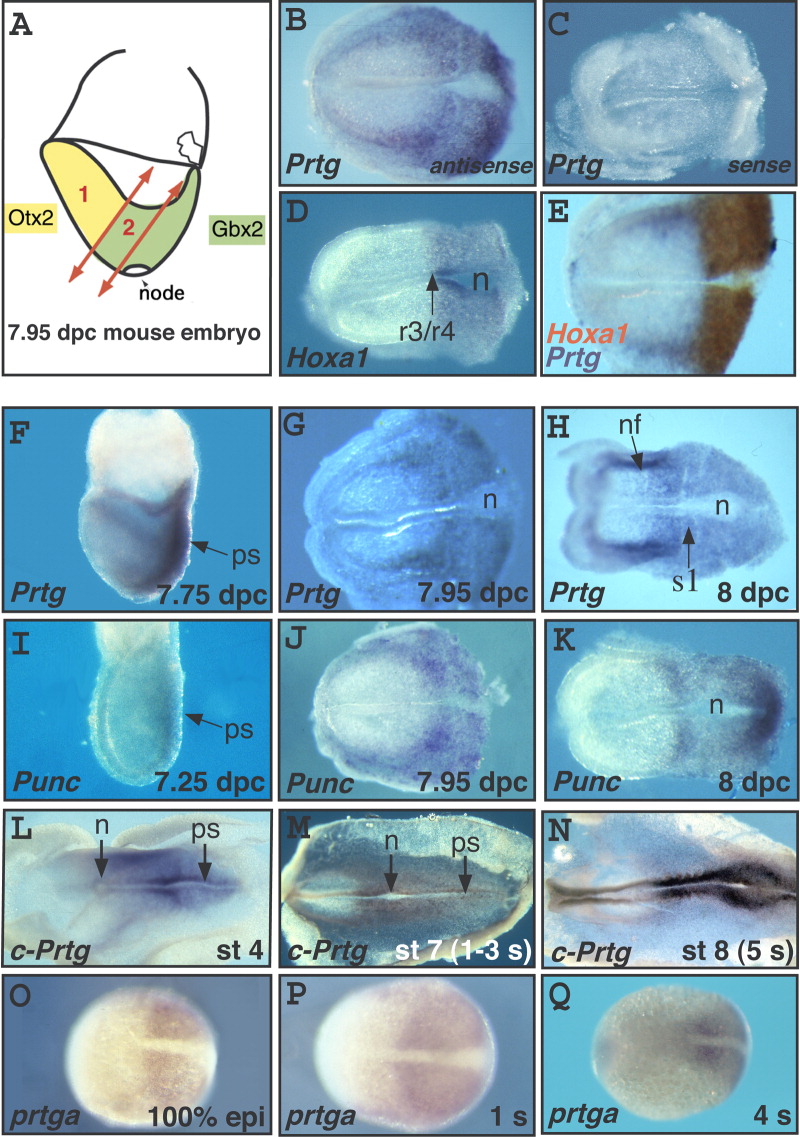
Fig. 1 Comparative analysis of Prtg expression at the end of gastrulation. A: Schematic representation of a mouse embryo at the headfold (7.95 days postcoitum [dpc]) stage, showing the two regions (1 and 2) from which RNA was extracted to build the subtracted libraries. B-D: In situ hybridization (ISH) on mouse embryos at the headfold stage with probes corresponding to the most frequently found genes from the posterior library: Prtg, a novel gene, represented by clone P1-50 (B and C for antisense and sense probe, respectively) and Hoxa1 (D). E: Double ISH with Prtg (blue) and Hoxa1 (red). In the medial neural plate, Hoxa1 and Prtg were coexpressed in the same anteroposterior (AP) domain giving rise to a brown staining. Laterally, cells expressing Prtg (blue cells) were present anterior to the Hoxa1 domain, near the borders of the neural plate. F-H: ISH on mouse embryos at the 7.75 dpc (F), 7.95 dpc (G), and 8 dpc (H) stages, with a Prtg probe. I-K: ISH on mouse embryos at the 7.25 dpc (I), 7.95 dpc (J), and 8 dpc (K) stages, with a Punc probe. L-N: ISH on chick embryos at stages 4 (L), 7 (M), and 8 (N), with a chick Prtg probe. O-Q: ISH on zebrafish embryos at the 100% epiboly (O), 1 s (P), and 4 s (Q) stages, with a zebrafish prtga probe. All embryos are oriented with anterior to the left. In B-E, G, H, J, and K, mouse embryos have been cut posterior to the node. n, node; nf, neural fold; ps, primitive streak; r, rhombomere; s1, somite 1; r3/r4 indicates the prospective boundary between rhombomeres 3 and 4 of the hindbrain.