
|
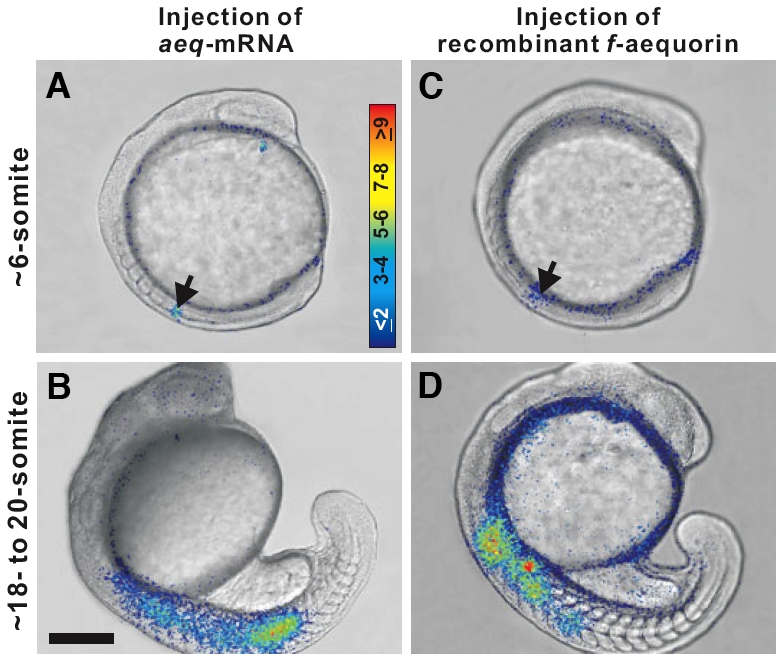
Fig. 6 A comparison of the intracellular Ca2+ signaling patterns observed in representative (A,B) aeq-mRNA injected embryos and (C,D) f-aequorin injected embryos during the Segmentation Period. (A,B) Embryos were injected with aeq-mRNA at the single-cell stage and then bathed with f-coelenterazine to reconstitute aequorin from apoaequorin. (C,D) Embryos were injected into the top of the yolk with f-aequorin during the Cleavage Period. (A,C) are trunk signals observed at ~6-somite stage, during early segmentation, while (B,D) are trunk signals that occur during later segmentation, at ~18 to 20-somite stage. Each panel represents 60 sec of accumulated light. Color scale indicates luminescent flux in photons/pixel. Scale bar, 200 μm.