
Image
|
Figure Caption
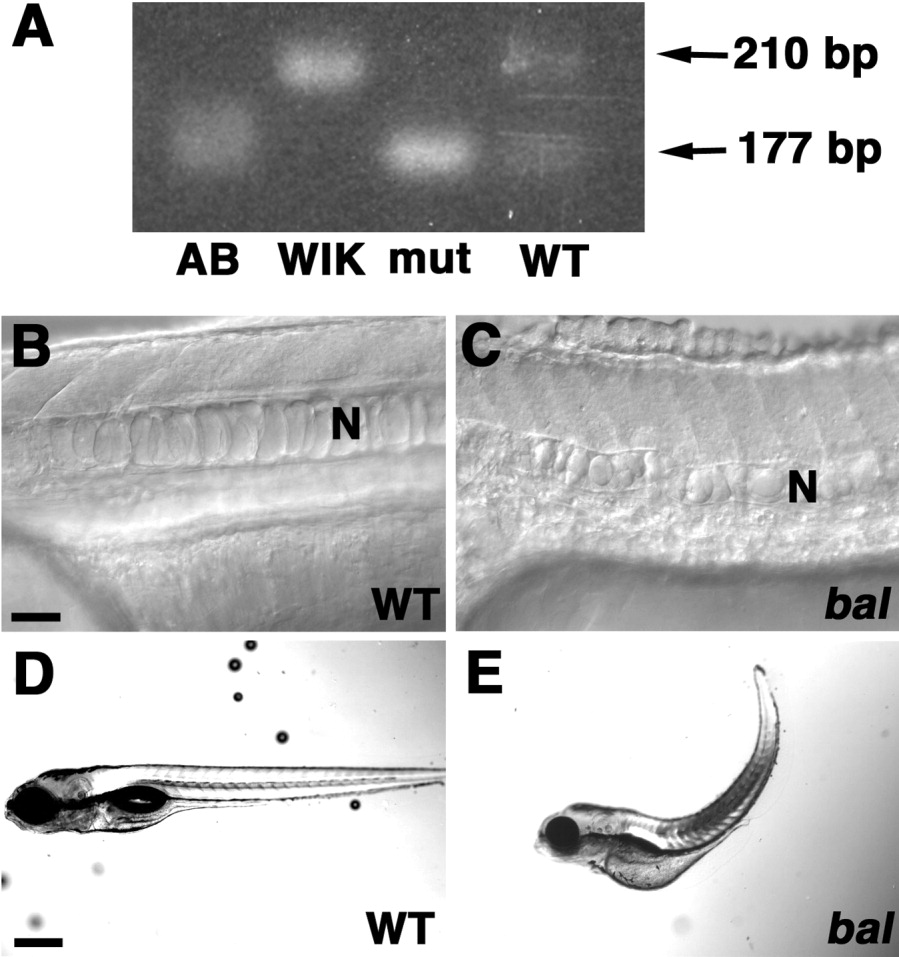
Fig. 1 Mapping and morphology of baluw1 embryos. A: Gel of polymerase chain reaction products showing a band at 177 bp from AB founder (AB), baluw1 mutant embryos (mut), and wild-type sibling embryos (WT). The band at 210 bp is only present in WIK founder (WIK) and WT lanes. B,C: Lateral views (anterior left) of 24 hpf WT (B) and baluw1 (C) trunks. N denotes notochord. D,E: 5 days postfertilization (dpf) WT (D) and baluw1 (E) embryos. Scale bars = 20 μm in A,B, 200 μm in C,D.
Acknowledgments
This image is the copyrighted work of the attributed author or publisher, and
ZFIN has permission only to display this image to its users.
Additional permissions should be obtained from the applicable author or publisher of the image.
Full text @ Dev. Dyn.