
IMAGE
Fig. 3
- ID
- ZDB-IMAGE-060110-3
- Genes
- Publication
- Lamason et al., 2005 - SLC24A5, a putative cation exchanger, affects pigmentation in zebrafish and humans
- All Figures
- Figures for Lamason et al., 2005
Image
|
Figure Caption
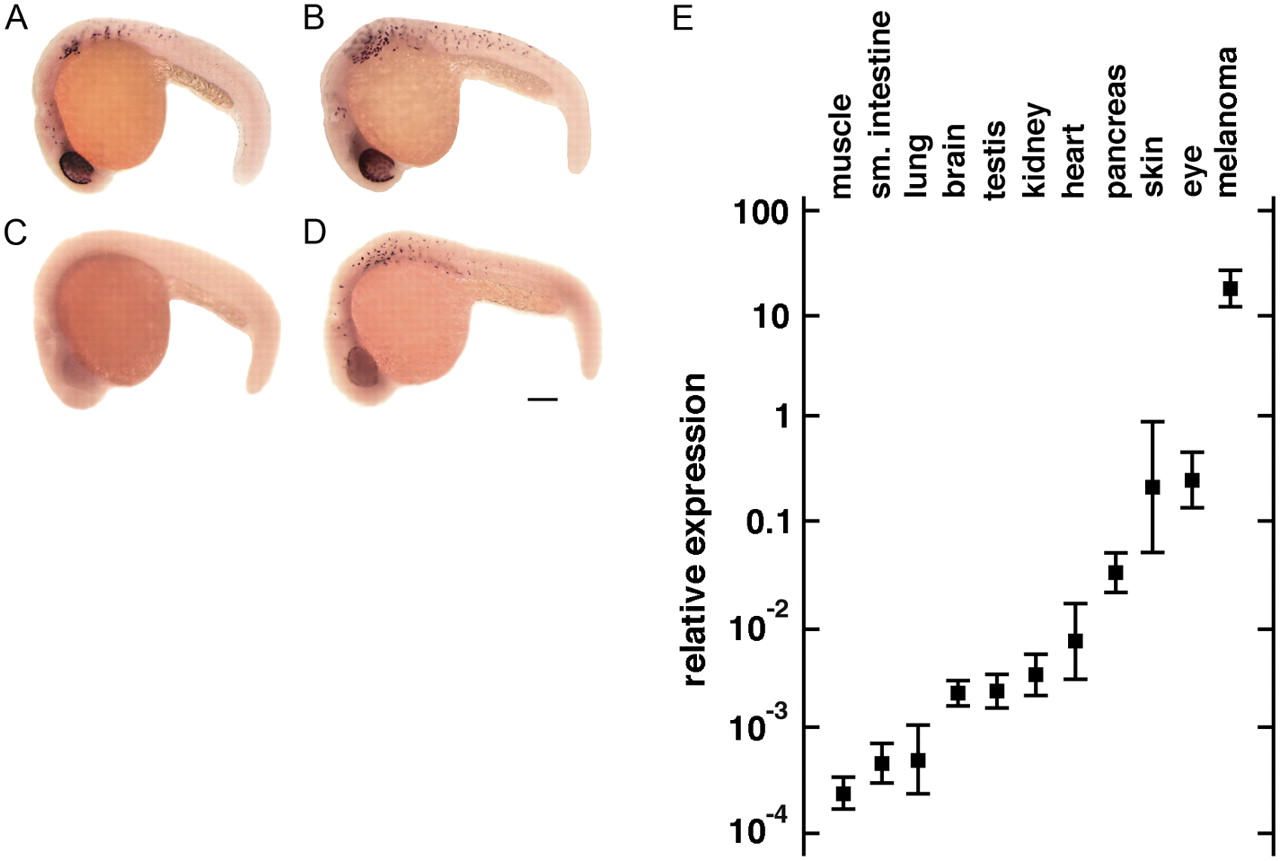
Fig. 3 Expression of slc24a5 in zebrafish embryos and adult mouse tissues. The expression of slc24a5 (A) and dct (B) in melanophores and RPE of a 24-hpf wild-type zebrafish larva show similar patterns. (C) golb1 larvae lack detectable slc24a5 expression. (D) dct expression in 24-hpf golb1 larva is similar to that in wild type. Scale bar, 200 µm. (E) Quantitative RT-PCR analysis of Slc24a5 expression in mouse tissues and B16 melanoma. Expression was normalized using the ratio between Slc24a5 and the control transcript, RNA polymerase II (Polr2e).
Figure Data
Acknowledgments
This image is the copyrighted work of the attributed author or publisher, and
ZFIN has permission only to display this image to its users.
Additional permissions should be obtained from the applicable author or publisher of the image.
Excerpted with permission from Lamason et al., Science 310(5755):1782-1786. Copyright 2005 AAAS. "Readers may view, browse, and/or download material for temporary copying purposes only, provided these uses are for noncommercial personal purposes. Except as provided by law, this material may not be further reproduced, distributed, transmitted, modified, adapted, performed, displayed, published, or sold in whole or in part, without prior written permission from the publisher."
Full text @ Science