
|
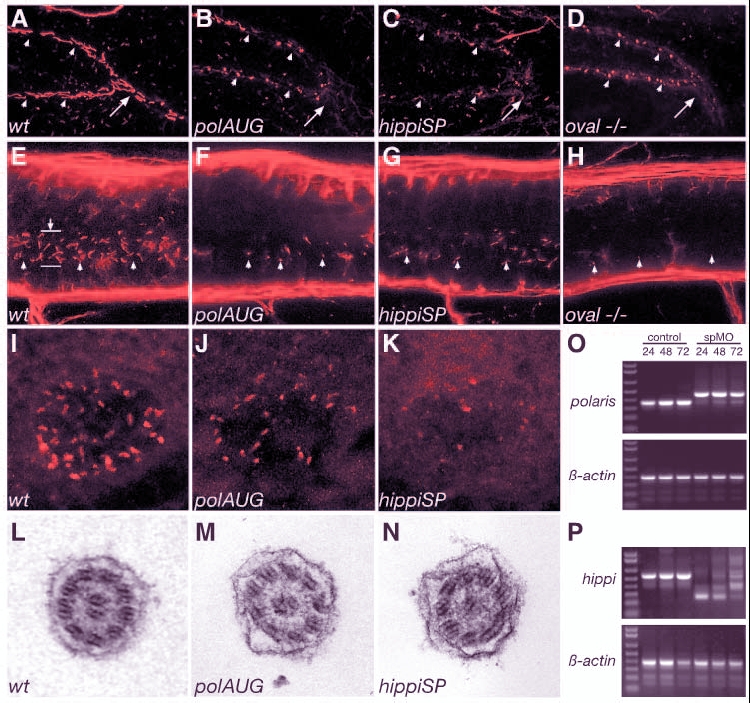
Fig. 2 Cilia structure is altered in IFT morphant embryos. A whole-mount confocal immunostaining of acetylated tubulin in 44 hpf embryos shows apical cilia in the pronephric ducts (A-D), the spinal canal (E-H) and Kupffer's vesicle (I-K). At 44 hpf polaris and hippi morphants (B,C), as well as oval homozygous mutant embryos (D), exhibit severely shortened cilia (arrowheads) compared with wild type (A). For reference, arrows in A-D indicate the point were the pronephric ducts merge at the cloaca. (E-H) Cilia (arrowheads) in the central canal (lumen indicated by arrow in E) of the spinal cord are also shortened or absent in polaris (F) and hippi (G) morphants and in oval-/- embryos (H) compared with wild type (E). Immunostaining of pronephros/central canal: anterior is to the left, dorsal to the top. Kupffer's vesicle cilia in polaris (J) and hippi (K) morphant embryos are greatly reduced compared with control (I). (L,M) Ultrastructure of the pronephric cilia in wild-type (L), polaris (M) and hippi (N) morphants show a typical 9+2 microtubule doublet pattern. (O) Molecular analysis of the effectiveness of SP-morpholinos inducing splice defects: RT-PCR of single embryos generates a 354 bp polaris fragment in control embryos, bridging part of exon 1 to part of exon 5 at 24, 48, 72 hpf (lane M, 1 Kb Plus DNA Ladder). polarisSP-injected embryos analyzed with the same primer sets at the same timepoints show a larger amplicon of 457 bp caused by a non-splicing of intron 2, which encodes a premature stop codon; the lower wild-type band recovers over time. Lower panel: RT-PCR of ß-actin of the same RNA samples. (P) RT-PCR of hippi mRNA results in a 553 bp fragment in control embryos, whereas the amplicon is reduced in size in the hippiSP-treated embryos, indicating an in-frame deletion of exon 2 and 3 (lower band, 260 bp) or an out-of-frame deletion of exon 2 only (middle band, 378 bp); there is recovery of the wild-type band over time.