
Fig. 3
- ID
- ZDB-IMAGE-050421-3
- Publication
- Montero et al., 2005 - Shield formation at the onset of zebrafish gastrulation
- All Figures
- Figures for Montero et al., 2005
|
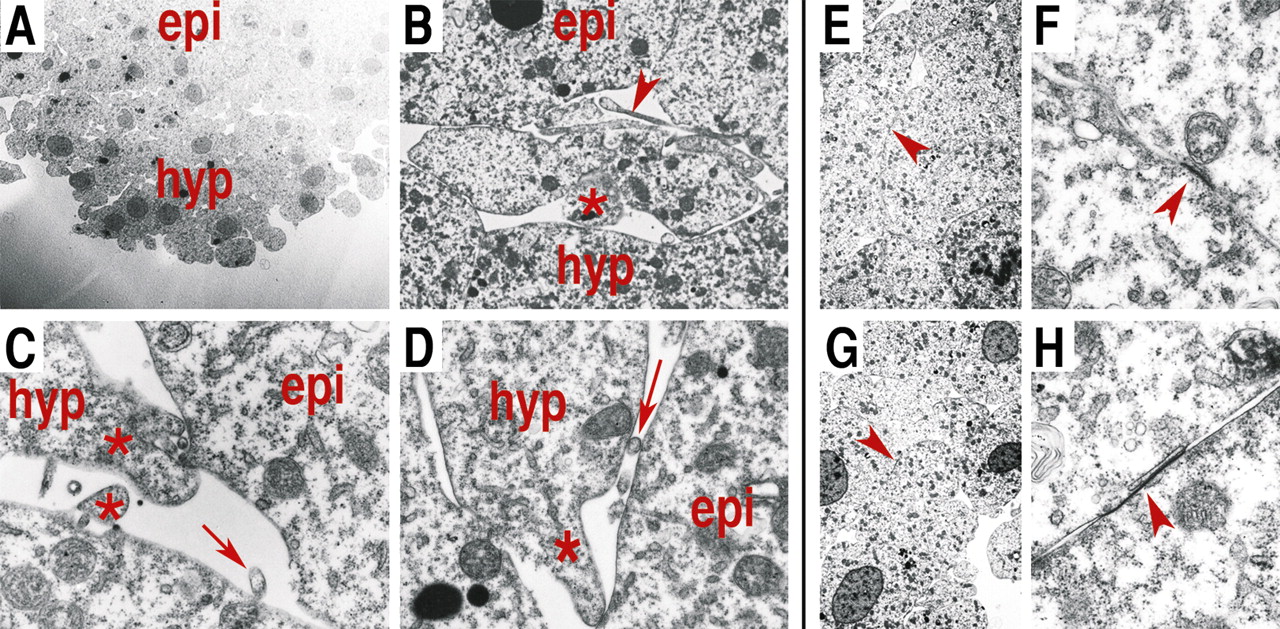
Fig. 3 Electron microscopy (EM) images of the border region between epiblast (ectoderm) and hypoblast (mesendoderm) at the onset of gastrulation (65% epiboly). (A) Frontal section of the shield region showing the apposition of epiblast and hypoblast tissues. (B) Multiple cellular processes crossing the border between epiblast and hypoblast. (C,D) Hypoblast cell process directly contacting an adjacent epiblast cell. (E-H) Structures resembling tight junctions between two epiblast (E,F) and hypoblast (G,H) cells at low (E,G) and high magnifications (F,H). Asterisks in B-D indicate cellular processes resembling pseudopods, arrowheads indicate structures resembling lamellipods and arrows indicate processes looking similar to filopods. Arrowheads in E,G point at the places within the epiblast and hypoblast, respectively, where the tight junctions shown in F,H were found. epi, epiblast; hyp, hypoblast.