
Fig. 2
- ID
- ZDB-IMAGE-050421-2
- Publication
- Montero et al., 2005 - Shield formation at the onset of zebrafish gastrulation
- All Figures
- Figures for Montero et al., 2005
|
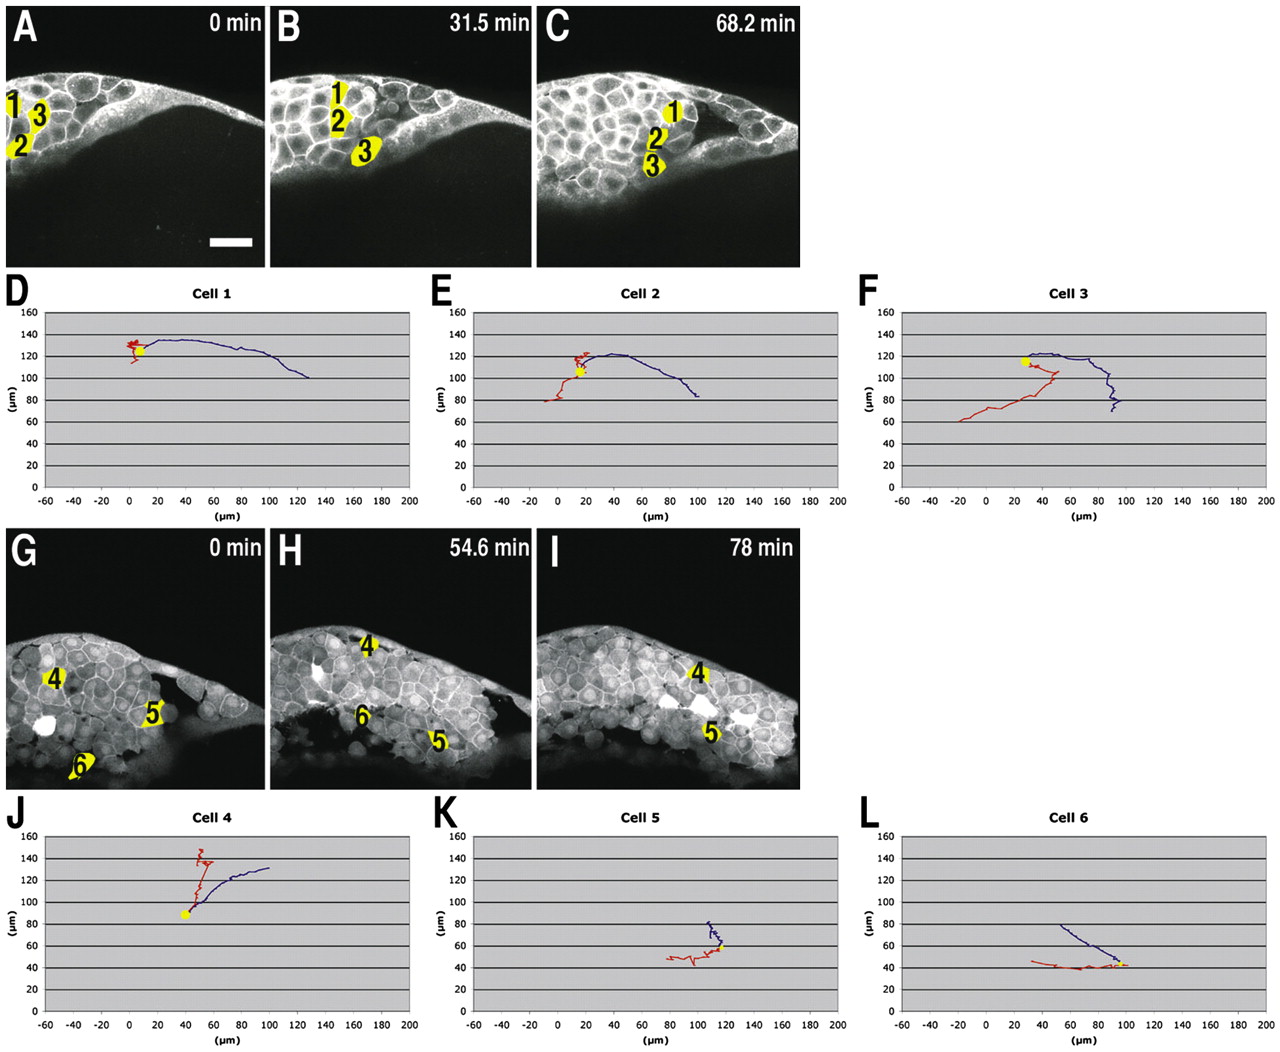
Fig. 2 Movement tracks of exemplary cells within the shield region during early stages of gastrulation. (A-C) Lateral (sagittal) views of the forming shield at 40% epiboly±0 minutes (A), +31.5 minutes (B) and +68.2 minutes (C). (D-F) Tracks of the three exemplary cells marked yellow in A-C. (G-I) Lateral (sagittal) views of the shield at 60% epiboly±0 minutes (G), +54.6 minutes (H) and +78 minutes (I). (J-L) Movement tracks of the three exemplary cells marked yellow in G-I. The cells were tracked in 2.6-minute time intervals for a total period of 68 (cells 1-3), 81 (cell 4), 66 (cell 5) and 60 (cell 6; note that this cell has already left the frame in I) minutes. For each exemplary cell, at least 10 other cells at similar positions within the germ ring from at least three independent movies were tracked. The blue tracks in D-F and J-L delineate the movement within the embryo, while the red tracks show the movement of the respective cell within the germ ring (for details see Materials and methods and Fig. S1 in supplementary material). The yellow dots (D-F,J-L) indicate the starting points of the cell tracks. Scale bar in A: 30 µm.