
Fig. 6
- ID
- ZDB-IMAGE-050307-6
- Genes
- Publication
- Amoyel et al., 2005 - Wnt1 regulates neurogenesis and mediates lateral inhibition of boundary cell specification in the zebrafish hindbrain
- All Figures
- Figures for Amoyel et al., 2005
|
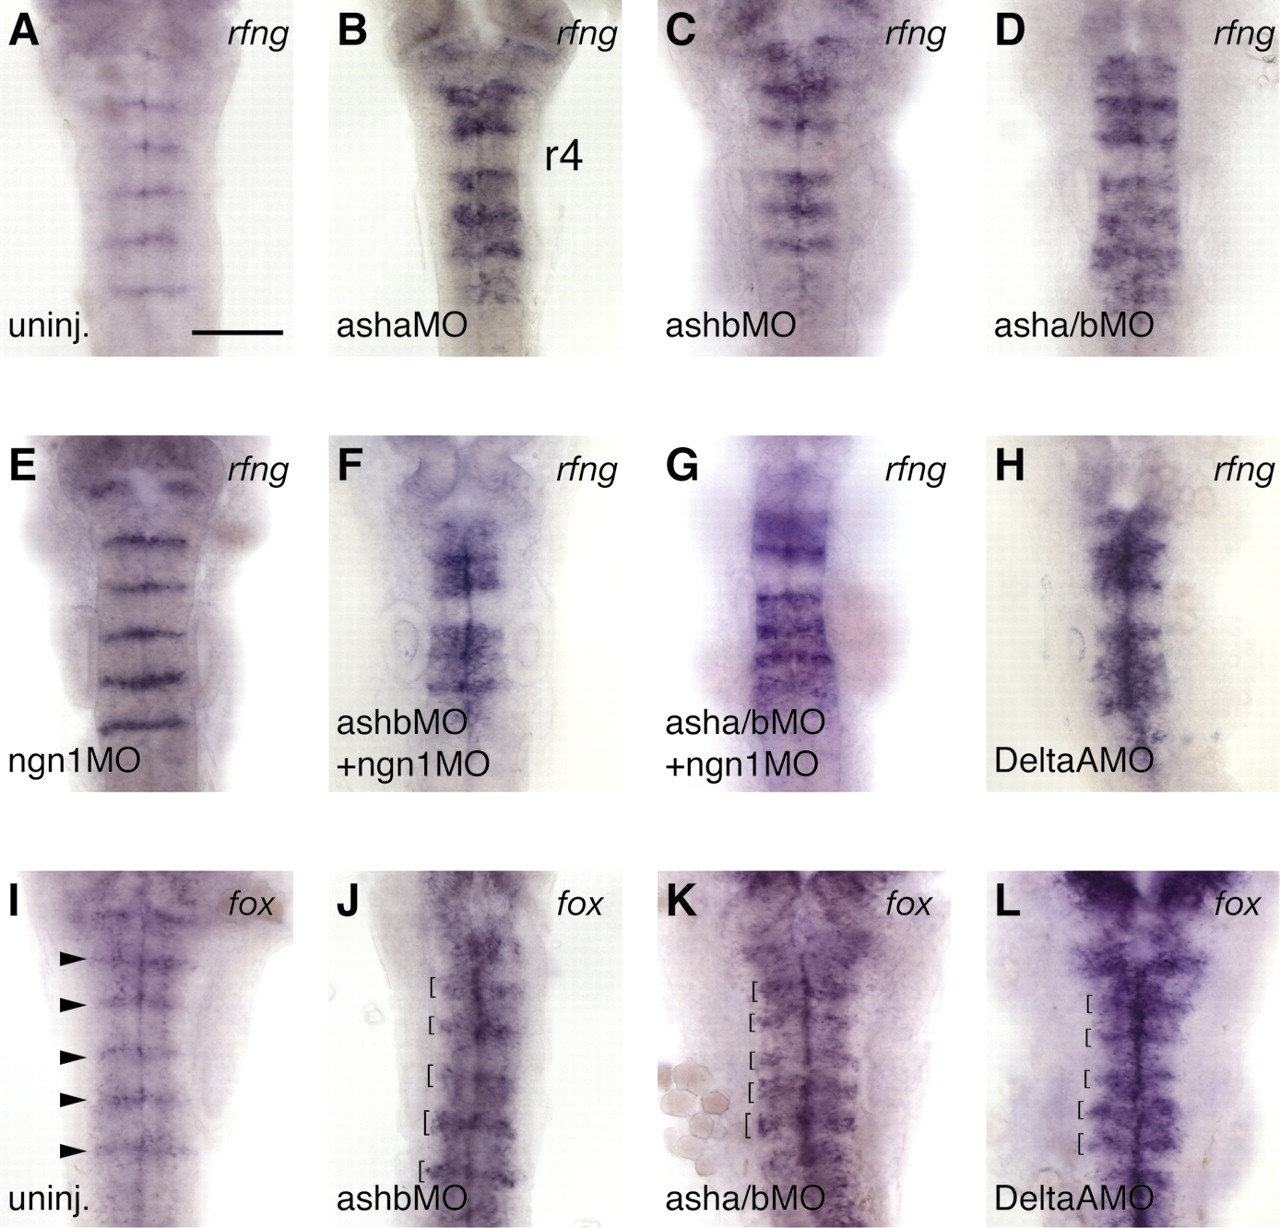
Fig. 6 Repression of boundary markers by proneural genes and deltaA. Expression at 24 hours of rfng (A-H) and foxb1.2 (fox, I-L) in uninjected embryos (A,I) and embryos injected with morpholinos to block proneural gene or deltaA function, as indicated (B-H,J-L). The probe is indicated at the top right of each panel. Expansion of rfng and foxb1.2 boundary expression occurs in proneural gene knockdowns (121/145 embryos), and following deltaA knockdown (24/24 embryos). Arrowheads in I indicate boundary expression of foxb1.2, which is broader in MO embryos (brackets, J-L). Different strengths of phenotype are observed following proneural gene knockdown, asha knockdown being the strongest (B) and ngn1 the weakest (E). Ectopic expression is not seen in r4, even in a knockdown of asha, ashb plus ngn1 (G). Scale bar: 100 µm