FIGURE SUMMARY
Title

Macrophages directly contribute collagen to scar formation during zebrafish heart regeneration and mouse heart repair

Authors
Simões, F.C., Cahill, T.J., Kenyon, A., Gavriouchkina, D., Vieira, J.M., Sun, X., Pezzolla, D., Ravaud, C., Masmanian, E., Weinberger, M., Mayes, S., Lemieux, M.E., Barnette, D.N., Gunadasa-Rohling, M., Williams, R.M., Greaves, D.R., Trinh, L.A., Fraser, S.E., Dallas, S.L., Choudhury, R.P., Sauka-Spengler, T., Riley, P.R.
Source
Full text @ Nat. Commun.

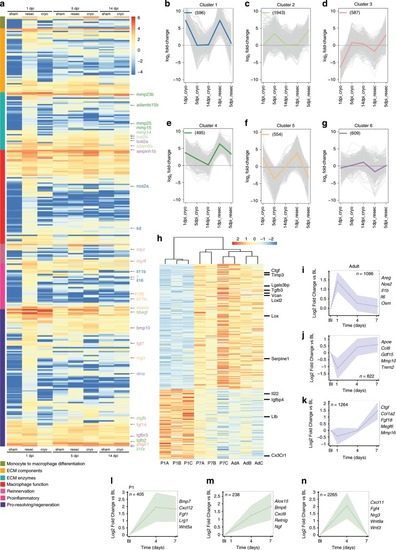
Transcriptomic analysis of macrophages in zebrafish and mouse injured hearts.

a Heatmap shows the log10 (normalised counts +0.01) of selected differentially expressed transcripts (adjusted p-value < 0.05). Red—high expression. Yellow—medium expression. Blue—low expression. Selected differentially expressed transcripts are further classified into subcategories of re-innervation (plum), extracellular matrix (ECM) components (yellow), ECM enzymes (turquoise), resolution of inflammation and regeneration (purple), pro-inflammatory mediators (pink), macrophage function (red) and monocyte to macrophage differentiation (green). bg Hierarchical clustering reveals dynamic gene signatures. Selected genes from individual clusters are highlighted on the heatmap. h Heatmap showing semi-hierarchical clustering of differentially expressed transcripts between regenerative (P1) and scar-forming (P7 and adult, Ad) mouse models at day 7 post-MI. Red—high expression. Yellow—medium expression. Blue—low expression. Selected genes are highlighted. ik Unbiased temporal clustering demonstrating dynamically regulated gene sets in macrophages across the phases of scar-based wound healing in the adult mouse heart post-MI. Significant profiles from the inflammatory (i), transition (j) and reparative (k) phases of wound repair are shown (n = number of genes within set), with selected genes highlighted. ln Unbiased temporal clustering demonstrating dynamically regulated gene sets in macrophages across the time period of regenerative healing in the P1 neonatal mouse heart post-MI. Significant profiles of gene sets upregulated (l, m) or transiently upregulated (n) in regeneration are shown (n = number of genes within set). Selected genes are highlighted.

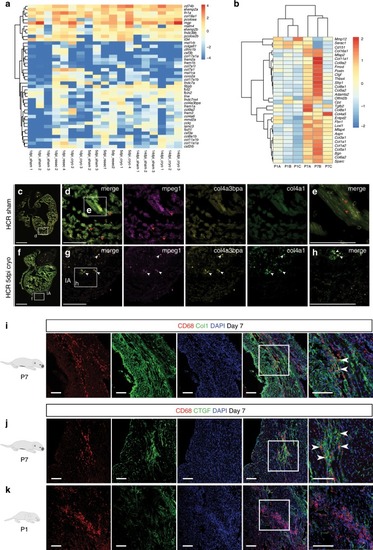
ECM proteins are expressed by macrophages during heart regeneration and scar formation.

a Heatmap shows the log10 (normalised counts +0.01) of differentially expressed transcripts for extracellular matrix (ECM) components. Red—high expression. Yellow—medium expression. Blue—low expression. b Heatmap showing expression of ECM components in the regenerating P1 and scar-forming P7 mouse at day 7. ECM genes for comparison were identified from those expressed by adult mouse macrophages during the reparative phase of post-MI (temporal profile Fig. 1k) which also linked to the Proteinaceous Extracellular Matrix GO term. Red—high expression. Yellow—medium expression. Blue—low expression. ch HCR confocal imaging of simultaneous mpeg1 (fuchsia), col4a3bpa (yellow) and col4a1 (green) mRNAs patterns in the heart. Higher abundance of col4a3bpa and col4a1 transcripts in macrophages (white arrowheads) present in the 5 days post cryoinjury heart (f, injured area shown by dotted line, white boxes enlarged in g, h for detail), when compared to sham-operated hearts (c, white boxes enlarged in d, e for detail). Red arrowheads point to macrophages in the sham-operated heart. Scale bar: 200 μm (insets showing high-magnification images, scale bar: 100 μm). dpi: days post injury. IA: injured area. Representative images of n = 3 per group. i Confocal imaging of immunofluorescence-stained heart cryosections at day 7 post-MI from P7 mice, showing CD68+ macrophages (red) in close colocalisation with collagen I (Col1, green) fibrils in the process of scar formation (representative images of n = 3, scale bar: 100 μm). j, k Confocal imaging of immunofluorescence-stained heart cryosections at day 7 post-MI from P1 and P7 mice, showing CD68+ macrophages (red) and Connective Tissue Growth Factor (CTGF; green), a soluble pro-fibrotic mediator driving activation of myofibroblasts. As suggested by transcriptional profiling of macrophages in regeneration and scar formation (Fig. 1h), CTGF is expressed widely by macrophages in the infarct zone of the P7 scar-forming heart (j), but minimally by macrophages in the P1 site of injury (k) (Representative images of n = 3 per group, scale bar: 100 μm).

Adult mouse splenic GFP<sup>+</sup> monocytes contribute collagen to the scar post-MI.

a Experimental design for adoptive transfer: monocytes were isolated by magnetic column purification from the spleens of adult GFPtpz-collagen+ mouse donors. At the time of MI surgery, 50 ± 10 × 103 monocytes/PBS, or PBS alone, were transferred to wild type (WT) recipients by intracardiac injection. Adult recipient mice were then harvested at either day 7 (b, c) or day 21 (d, e) for immunostaining. b At day 7 post-MI, combined immunostaining for α-GFP (red; to exclude autofluorescence from monitoring GFP-alone) and α-CD68 revealed GFP+ macrophages within the scar region (sc) of the left ventricle (lv). c Co-staining for collagen-1 (white, Col1) revealed GFP+ collagen deposits within the same scar region. d By day 21, there was increased GFP+ collagen deposition within the scar (white inset boxes in upper panels shown at higher magnification in corresponding panels below). e GFP+ collagen fibres were evident within regions of transmural scar, as detected by combined α-GFP and Col1 staining (white inset boxes in upper panels shown at higher magnification in corresponding panels below). lv, left ventricle, pm, papillary muscle; sc, scar. Scale bars: b, c upper panel, d upper panel 100 μm; c lower panel, d lower panel 50 μm. Representative images of n = 3 per group.

Adult monocytes disrupt regeneration of P1 mouse heart and deposit collagen within a post-MI scar.

a Adult splenic monocytes from hCD68-GFP+ donors were transferred by intracardiac injection at time of MI surgery (50 ± 10 × 103 cells). P1 neonates were then harvested at day 3 (for imaging) or day 21 (for histology). b GFP Fluorescence imaging demonstrating adoptively transferred GFP+ monocytes were present in the anterior wall of the recipient P1 at day 3 post-MI (scale bar: 1 mm). c Masson’s trichrome staining of heart sections showing that at day 21 post-MI, P1 neonates which received PBS vehicle showed histological evidence of regeneration. d P1 neonates which received adult monocytes show residual scar formation. Scale bar: 1 mm. e Adoptive transfer of adult monocytes led to a significant increase in scar size at 21 days, measured as percentage of the left ventricular area (scar percentage 3.99 ± 0.74% vs 0.81 ± 0.25%, n = 5 in PBS group, n = 6 in monocyte group, **p< 0.01, data are mean ± SEM, 2-tailed, unpaired Student’s t-test). f Splenic monocytes transferred from adult GFPtpz-collagen mice to P1 recipients undergoing MI. g Confocal imaging of immunofluorescence-stained heart cryosections at day 3 post-MI revealed emergent GFP+ fibres within the scar region and a subset of α-CD68+ macrophages co-labelled for GFP indicating that they had arisen from donor monocytes and had activated the GFPtpz-collagen 1. Scale bars, 500 μm (low power panel), 100 μm (high power panels). h, i By day 21 post-MI, recipient P1 mice revealed GFP+ scars within the non-regenerated myocardium (schematised hearts; black inset boxes relate to immuno-stained regions in the vicinity of the ligating suture) (h) or within the injury area (top two panels in i; black dashed inset box relates to injury region depicted in bottom two panels in i). Both GFP fluorescence and α-GFP staining revealed evidence of donor-monocyte-derived GFP+ collagen fibrils which were Col1+ within the scar at day 21 post-MI. Scale bars, 500 μm (low power panel), 100 μm (high power panels). ep, epicardium; my, myocardium; P1, post-natal day 1; sc, scar. Representative images of n = 3 per group. Source data are provided as a Source Data file.

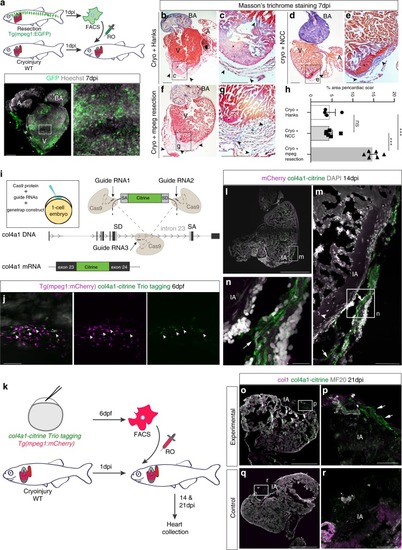
Zebrafish macrophages directly contribute to transient scar formation by collagen synthesis.

a Adoptive transfer of GFP+ macrophages derived from a resection heart into a cryoinjured heart via retro-orbital (RO) injection. Wholemount heart showing transplanted macrophages in 7 days post injury (dpi) recipient hearts, hoechst-stained nuclei in grey. Scale bars: 200μm, high-magnification 100 μm. bg Masson’s trichrome staining of Hanks-injected (b; high-magnification in c), neural crest cells (NCC)-transplanted (d; high-magnification in e), and macrophages-transplanted (f; high-magnification in g) hearts showing pericardiac fibrosis (blue, arrowheads) around the cryoinjured area (pink, black asterisk). Scale bars: 200 μm, high-magnification: 50 μm. h Quantification of scar fibrosis (percentage of total section area, 6 sections per heart: hanks-injected 4.611 ± 1.26%, n = 4 vs macrophage-transplanted 14.87 ± 0.81%, n = 6; ***p< 0.0001; NCC-transplanted 4.53 ± 0.643%, n = 6 vs macrophage-transplanted 14.87 ± 0.81%, n = 6; ***p< 0.0001; hanks-injected 4.611 ± 1.26%, n = 4 vs NCC-transplanted 4.53 ± 0.643%, n = 6; p= 0.951, ns, not significant). 2-tailed, unpaired Student’s t-test, data are mean ± SEM. i “Trio” tagging approach: Cas9 protein, guide RNAs and genetrap construct coding for Citrine, are injected in 1-cell stage embryos. Double-strand breaks are generated in the col4a1 intron and the donor construct, resulting in integration of Citrine ORF flanked by splice acceptor (SA) and donor (SD) sites, ultimately ensuing a col4a1-Citrine fusion protein. j Mosaic expression of col4a1-Citrine observed in 6 dpf macrophages (arrowheads) of “trio” tagging-injected embryos. Scale bar: 50 μm. k Adoptive transfer of mCherry+ macrophages, FAC-sorted from “trio” tagging-injected embryos, transplanted into WT cryoinjured heart via RO injection. ln 14 dpi WT hearts transplanted with col4a1-Citrine mCherry macrophages. Very few transplanted macrophages (m, arrowhead) are still present in the injury region (dashed line and IA in l, IA in m, n). Macrophage-deposited mosaic “green” scar is observed extracellularly, near the injured area (arrows m, n, DAPI-stained nuclei in grey). (or) 21 dpi WT transplanted hearts reveal a mosaic scar (arrows), also stained for collagen 1 (fuschia), peripheral to the MF20-negative injury area (dashed line and IA in o, IA in p), not observable in control conditions (q, r). Scale bars ln: 200 μm, high-magnification: 100 μm). Representative images of n = 3 per group. Source data are provided as a Source Data file.

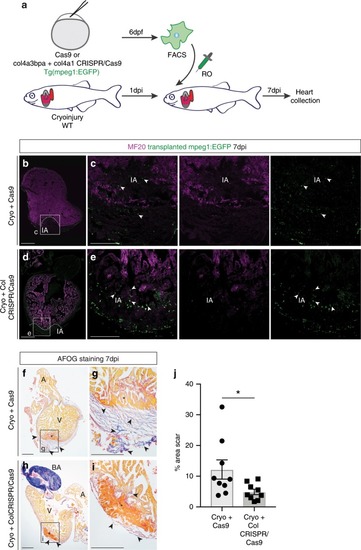
Targeting <italic>col4a1</italic> and <italic>col4a3bpa</italic> in macrophages reduced scarring in zebrafish cryoinjured hearts.

a Schematics of adoptive transfer of GFP+ macrophages sorted from embryos injected with Cas9 only or col4a3bpa plus col4a1 sgRNAs/Cas9 and transplanted into a cryoinjured heart via retro-orbital (RO) injection. be Confocal imaging of anti-MF20 (fuschia) and anti-GFP (green) antibody-stained WT recipient hearts of Cas9 only (b, white boxes enlarged in c for detail) and col4a3bpa plus col4a1 sgRNAs/Cas9 (d, white boxes enlarged in e for high-magnification) transplanted macrophages (GFP+) collected 7 days post injury (dpi). Arrowheads point to GFP+ transplanted macrophages that are located in the site of injury (IA). Scale bar: 200 μm (insets showing high-magnification images, scale bar: 100 μm). Dotted line demarcates the MF20-negative injured area. Representative images of n = 3 per group. (fi) AFOG staining of representative images showing healthy myocardium (yellow), injured myocardium (orange) and collagen (blue). Excess scar tissue (arrowheads) at the periphery of the cryoinjured area (black asterisk) is seen in hearts transplanted with 6 days post fertilization (dpf) GFP+ macrophages injected with Cas9 only (f, with high-magnification inset in g). Hearts transplanted with col4a1+col4a3bpa CRISPR/Cas9 macrophages show reduced collagen staining (h, with high-magnification inset in i); red asterisk, myocardial dead tissue removed from the injury region. Representative images of n = 3 per group. j Quantification as a percentage of total section area (6 sections per heart) show significantly less scar fibrosis in the group of cryoinjured hearts transplanted with col4a1+col4a3bpa CRISPR/Cas9 macrophages (Cryo+Cas9: 12.18 ± 3.12%, n = 9 vs Cryo+Col CRISPR/Cas9: 4.91 ± 0.88%, n = 9; *p= 0.039; data are mean ± SEM, 2-tailed, unpaired Student’s t-test). Scale bar: 200 μm; high-magnification insets scale bar: 50 μm; A, atrium; V, ventricle; BA, Bulbus Arteriosus. Source data are provided as a Source Data file.

Acknowledgments
This image is the copyrighted work of the attributed author or publisher, and ZFIN has permission only to display this image to its users. Additional permissions should be obtained from the applicable author or publisher of the image. Full text @ Nat. Commun.