- Title
-
Generation and characterization of Kctd15 mutations in zebrafish
- Authors
- Heffer, A., Marquart, G.D., Aquilina-Beck, A., Saleem, N., Burgess, H.A., Dawid, I.B.
- Source
- Full text @ PLoS One
|
kctd15 mutants show up-regulation of several NC gene markers. foxd3 (A-C) and sox10 (D-F) expression is indistinguishable between WT and mutants very early in NC development, but by 3-4s, expression of these markers shows both an expansion and up-regulation in expression, which persists at 8-9s. Other NC markers, including dlx3b (G), sox9b (H), tfap2a (I) and snail1b (J) also show up-regulation and expansion in our mutants at 8-9s. Additionally, an increase in NC cell number is apparent at 24hpf in kctd15 mutants, as visualized in a sox10-GFP reporter construct (K). EXPRESSION / LABELING:
PHENOTYPE:
|
|
kctd15 mutants have more melanophores. While there is no premature appearance of melanophores in our mutants (A,B), by 5 dpf there are visibly more on the dorsal side of the head (C,D), and by 19 dpf, there is a marked increase in melanophore pigment cells both on the dorsal and lateral sides of the larvae (E,F). This increase in pigmentation is still seen at 30 dpf (G,H). Examination of transcript levels and expression patterns in 25 hpf embryos revealed an up-regulation of the early melanophore markers tyrp1a (I-K) and zgc:91968 (L-N). EXPRESSION / LABELING:
PHENOTYPE:
|
|
Kctd15 mutant larvae have more xanthophores. At 6 dpf, there are more mature xanthophores, as indicated by methylene blue staining (A); however, their appearance is just like WT (B). Examination of genes involved in xanthophore specification showed that there was an increase in abundance of gch2 transcripts at 25 hpf (C-E), most notably in the cranial pigment cells. |
|
Kctd15 is required for proper jaw formation later in development. Alcian blue/Alizarin red staining does not reveal any early structural abnormalities in the patterning of kctd15 mutant jaws (A,B). However, adult mutants exhibit shortening of several jaw elements, including the dentary, maxillary and frontal regions (C). While mRNA staining at 6 dpf for col10a1a showed no difference in patterning of early craniofacial bones (D,E), adult double mutants lack a properly formed maxilla bone (F,G; abnormalities are indicated by an asterisk and arrow). |
|
Kctd15 mutants are smaller in size. A) Growth of wild-type and mutant larvae, measured at 5, 12, 18, 22 and 28 dpf. While the difference in size is noticeable at 12 dpf (B), the difference is not significant until 18 dpf (C), when a range of sizes is seen, ranging from somewhat smaller (mut #1) to much smaller (mut #2). Adult mutants remain significantly smaller than wild-type siblings, even after a year (D,E). PHENOTYPE:
|
|
Kctd15 mutants are missing the torus lateralis (TLa). Total-ERK (tERK) antibody staining of (A) wild-type and (B) mutant 6 dpf larvae. C) Pixels whose intensity values are statistically significantly different between wildtype and mutant brains (p < 0.05, N = 14 per group, see Methods for statistical comparison procedure). Sectioning and H+E staining of a large region of adult (5 month old) wild-type (D) and mutant (E) brains revealed that this structure (green square in D) is absent throughout development. At least fifteen larval brains and five adult brains from each genotype were analyzed to confirm these results. PHENOTYPE:
|
|
TLa ablation resulted in larva of smaller size. A) Construct design for generating a stable GFP transgenic line. 1.5kb upstream of the initiation codon of kctd15a was cloned upstream of GFP and inserted into the genome using Tol2. B) A dorsal maximum projection of an average representation of the transgenic line at 6 dpf (green) overlayed on vGLUT expression (gray) shows strong expression in the pallium region of the forebrain and torus lateralis in the midbrain. The superimposed heat map indicates the region missing in our kctd15 mutants. C) Growth measurements taken over the course of 5 weeks of non-ablated control larva (see methods; n = 39–55 per time point), control pallium ablated (n = 8 per time point), TLa ablated (n = 24–26 per time point) and kctd15 mutants (n = 28 per time point). At 6 dpf entire larval length was measured, at all other time points standard length (SL) was measured. See text for ANOVA results. For post-hoc t-tests: (a) indicates p < 0.05 for torus lateralis (TLa) ablated compared to intact control or pallium ablated controls. (b) indicates p < 0.05 for TLa compared to kctd15 mutants. EXPRESSION / LABELING:
|

ZFIN is incorporating published figure images and captions as part of an ongoing project. Figures from some publications have not yet been curated, or are not available for display because of copyright restrictions. |
|
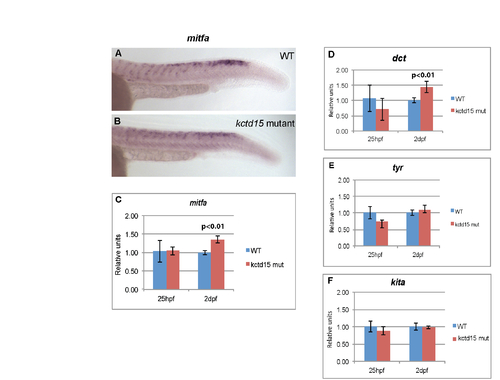
Genes known to be involved in melanophore development that are unaffected by loss of Kctd15. Expression of mitfa is unchanged at 25 hpf (A-C), and only shows up-regulation at 48 hpf (C), after establishment of melanophore cells. A similar pattern is seen with dct transcripts at 25 and 48 hfp (D). Expression levels of tyr (E) or kita (F) are unaffected in our mutants compared to wild-type. |
|
There is no early up-regulation of mature xanthophore number in our mutants, as visualized by Pax7 antibody staining (A,B). Other gene markers known to be involved in the specification of xanthophores early in development, including csf1ra (C), xdh (D) and pax7b (E) are not up-regulated. |
|
Loss of Kctd15 has no effect on glial cell markers in early development. Expression of foxd3 (A,B) and sox10 (C,D) transcripts at 48 hpf in kctd15 mutants shows no change in expression patterns of either cranial glia or trunk glia. |
|
kctd15 mutants lack all facial barbels. WT fish have 2 sets of facial barbels, nasal and maxillary (A), both of which are missing in kctd15 mutants (B,C). While WT fish may have fewer than 4 due to a loss for several reasons, kctd15 mutants never have any. PHENOTYPE:
|
|
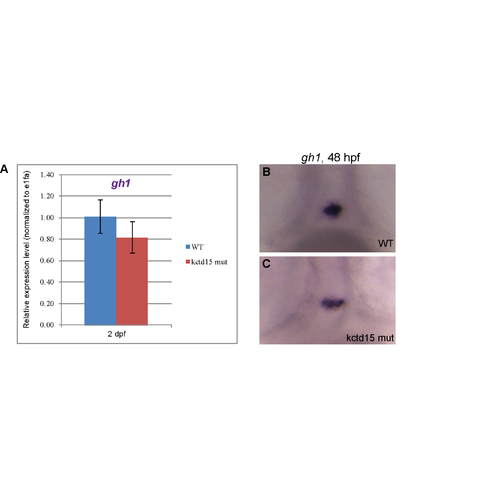
Kctd15 mutants show gh RNA levels similar to wild type. gh levels were examined by qPCR (A) and in situ hybridization (B) in WT and mutant embryos at 48 hpf. While there is a general trend towards lower gh levels, this difference is not significant. In ~60% of embryos, the staining pattern of gh transcripts appears more sparse (in fewer cells), when compared to the rosette pattern observed in WT. |
|
GFP expression in the TLa. Single horizontal (A) and coronal (B) z-stack images taken during confocal scanning of Tg(1.5kb-kctd15a-GFP) show GFP expression in the TLa. The heat maps in the single slices indicate the region missing in our kctd15 mutants. |


