FIGURE SUMMARY
Title

Structural and biochemical characterization of the 3'-5' tRNA splicing ligases

Authors
Chamera, S., Zajko, W., Czarnocki-Cieciura, M., Jaciuk, M., Koziej, Ł., Nowak, J., Wycisk, K., Sroka, M., Chramiec-Głąbik, A., Śmietański, M., Gołębiowski, F., Warmiński, M., Jemielity, J., Glatt, S., Nowotny, M.
Source
Full text @ J. Biol. Chem.

Chemical crosslinking of Tb-RtcB and RNA.A, schematic representation of the ligation reaction performed by RtcB. Blue part corresponds to the fragment that was used for the design of RNA substrates for chemical crosslinking. B, structural analysis. AlphaFold 2 model of Tb-RtcB, structure of Ph-RtcB (PDB ID: 4ISJ), and structure of Ph-RtcB–DNA complex (PDB ID: 7LFQ) were superimposed. The panel shows sulfate (S1, S2) ions from 4ISJ structure (cyan), amino acid residues from the Tb-RtcB AlphaFold 2 model predicted to interact with RNA (shown as gray sticks), and DNA from Ph-RtcB–DNA complex structure (shown in yellow). C, same superposition as in (B) but with Ph-RtcB–DNA complex structure (PDB ID: 7LFQ) shown in pink cartoon for protein and DNA in yellow. Selected residues of AlphaFold 2 model of Tb-RtcB are shown as gray sticks. Active site residues of Ph-RtcB are shown as pink sticks. D and E, SDS-PAGE analysis of results of the cross-linking reactions of the Tb-RtcB mutants and the cystamine-modified RNA substrates. A schematic representation of the substrates is shown on the left side of the gels. Black dot represents the cystamine modification. In all cases, the blue asterisks mark specific crosslinks, whereas the red asterisks mark unspecific or protein–protein crosslinks. CTRL stands for reactions with protein only. L, molecular weight ladder; PDB, Protein Data Bank; Ph-RtcB, Pyrococcus horikoshii RtcB; Tb-RtcB, RtcB from archaeon Thermococcus barophilus.

Purification of the Dr-tRNA-LC.A, SDS-PAGE analysis of fractions from gel filtration. B and C, chromatograms from gel filtration. Dr-tRNA-LC, ligase complex from Danio rerio; FL, full-length version of Dr-tRNA-LC; L, molecular weight ladder; TR, truncated version of Dr-tRNA-LC.

Characterization of the purified FL and TR Dr-tRNA-LC.A, binding curves of titration of purified tRNA-LC with fluorescently labeled zebrafish tRNAIle. Error bars indicate SD. n = 3 (independent dilution series, measurements of all three replicas are shown). B, size analysis by DLS of purified FL (green) and TR (blue) tRNA-LC in the presence or the absence of tRNAIle. n = 5 (technical replicates). C, first derivative of thermal melting curves obtained for purified FL (green; right) and TR (blue; left) tRNA-LC in the presence or the absence of tRNAIle. Inflection points used for Tm value calculation are indicated by vertical lines. n = 5 (technical replicates). D, quantification of the presented results. DLS, dynamic light scattering; Dr-tRNA-LC, ligase complex from Danio rerio; FL, full-length; rH, hydrodynamic radius; TR, truncated LC; tRNA-LC, tRNA ligase complex.

Ligase activity of Dr-tRNA-LC.A, urea-PAGE analysis of the products of the enzymatic reaction carried out by the Dr-tRNA-LC (full-length [FL] and truncated [TR] variant) on the tRNA exon halves substrate. All reactions were performed in three replicates. B, urea-PAGE analysis of the products of the enzymatic reaction carried out by the Dr-tRNA-LC (FL and TR variant) on the short RNA substrate. Control reaction (CTRL) contained the RNA substrate and Dr-Archease but did not contain Dr-tRNA-LC. “–Arch” lane is the reaction without Dr-Archease. L, RNA corresponding to the expected product of the reaction. RA denotes the lane with R263A mutant. A schematic representation of the substrate and product is shown on the right. All reactions were performed in four replicates, (C) quantification of the data in (B). All four data points are plotted with error bar representing the SD of the measurements. Dr-tRNA-LC, ligase complex from Danio rerio.

Structure and model of Dr-tRNA-LC-TR.A, 3.3 Å cryo-EM reconstruction of Dr-tRNA-LC-TR. B, atomic model built based on the reconstruction. Dr-tRNA-LC, ligase complex from Danio rerio; TR, truncated version.

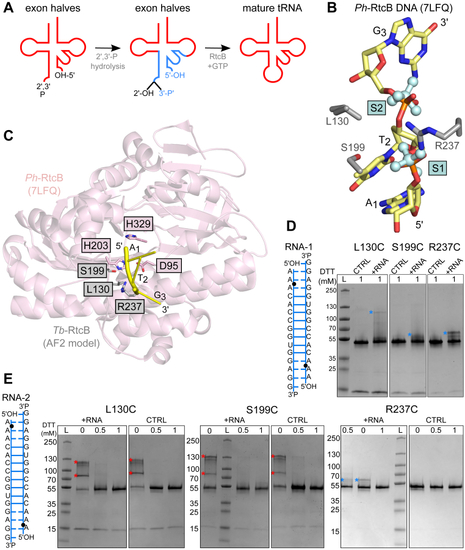
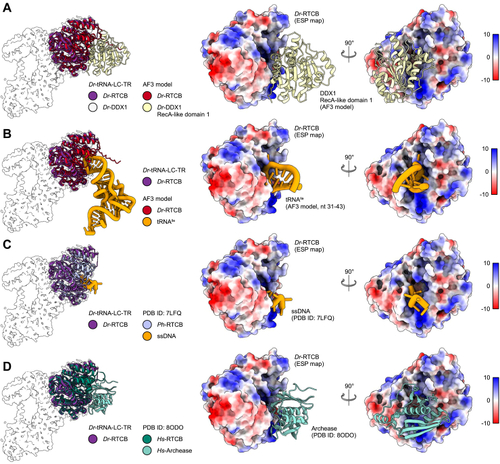
The position of DDX1 subunit in Dr-tRNA-LC.A, superimposition of the AlphaFold 3 model of the Dr-tRNA-LC-FL on Dr-RTCB from the Dr-tRNA-LC-TR structure. Left, Dr-RTCB and Dr-DDX1 shown on the contour of the Dr-tRNA-LC-TR map. Right, modeled interaction between DDX1 RecA-like domain 1 (AlphaFold 3 model) and Dr-RTCB (shown as Coulombic electrostatic potential surface); two views. B, superimposition of the AlphaFold 3 model of the Dr-tRNA-LC-TR-tRNAIle on Dr-RTCB from the Dr-tRNA-LC-TR structure. Left, Dr-RTCB and tRNAIle shown on the contour of the Dr-tRNA-LC-TR map. Right, modeled interaction between tRNAIle (AlphaFold 3 model; only anticodon loop is shown for clarity) and Dr-RTCB (shown as Coulombic electrostatic potential surface); two views. C, superimposition of Ph-RtcB in a complex with ssDNA (PDB ID: 7LFQ) on Dr-RTCB from the Dr-tRNA-LC-TR structure. Left, Dr-RTCB, Ph-RTCB, and ssDNA shown on the contour of the Dr-tRNA-LC-TR map. Right, modeled interaction between ssDNA and Dr-RTCB (shown as Coulombic electrostatic potential surface); two views. D, superimposition of Hs-RTCB in complex with Archease (PDB ID: 8ODO) on Dr-RTCB from the Dr-tRNA-LC-TR structure. Left, Dr-RTCB, Hs-RTCB, and Hs-Archease shown on the contour of the Dr-tRNA-LC-TR map. Right, modeled interaction between Archease and Dr-RTCB (shown as Coulombic electrostatic potential surface); two views. Dr-tRNA-LC, ligase complex from Danio rerio; FL, full length; Hs, Homo sapiens; PDB, Protein Data Bank; Ph-RtcB, Pyrococcus horikoshii; TR, truncated version.

Acknowledgments
This image is the copyrighted work of the attributed author or publisher, and ZFIN has permission only to display this image to its users. Additional permissions should be obtained from the applicable author or publisher of the image. Full text @ J. Biol. Chem.