
- Title
-
Gingipains protect Porphyromonas gingivalis from macrophage-mediated phagocytic clearance
- Authors
- Widziolek, M., Mieszkowska, A., Marcinkowska, M., Salamaga, B., Folkert, J., Rakus, K., Chadzinska, M., Potempa, J., Stafford, G.P., Prajsnar, T.K., Murdoch, C.
- Source
- Full text @ PLoS Pathog.
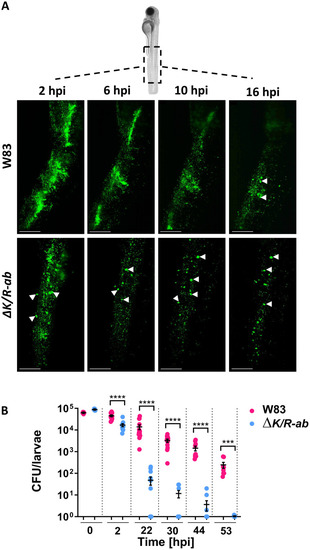
Wild-type Zebrafish embryos were infected systemically at 30 hpf with fluorescein-SE-labelled wild-type |
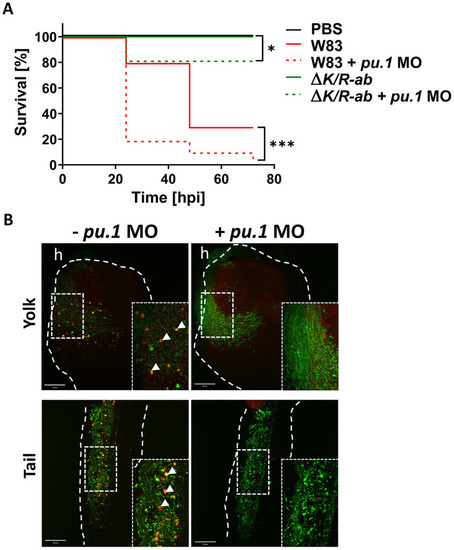
Myeloid cell-depleted zebrafish larvae are more susceptible to (A) Kaplan-Meyer survival plot of |
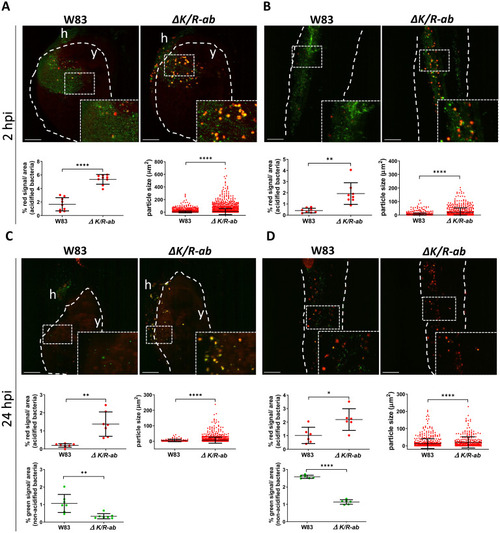
Gingipains prevent phagosome acidification of internalized Real-time in vivo examination of the acidification of the wild-type |
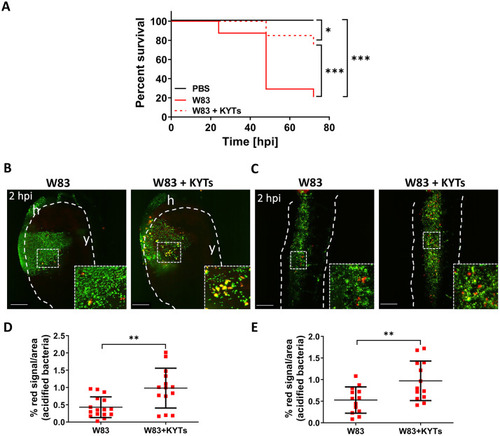
Inactivation of gingipains by KYT inhibitors increases larvae survival and increases phagocytosis of wild-type W83 (A) Kaplan-Meier survival plot of zebrafish larvae (30 hpf) infected with wild-type |
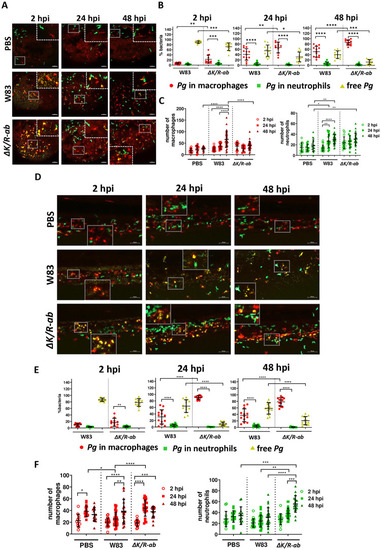
The role of macrophages and neutrophils in the eradication of Zebrafish larvae (30 hpf) were infected systemically with AlexaFluor647–SE labelled wild-type |
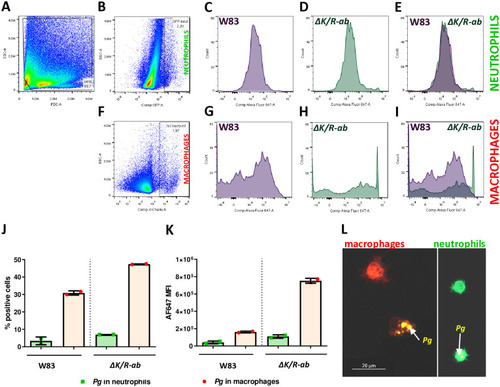
Flow cytometry analysis of phagocytosis of Transgenic zebrafish larvae |
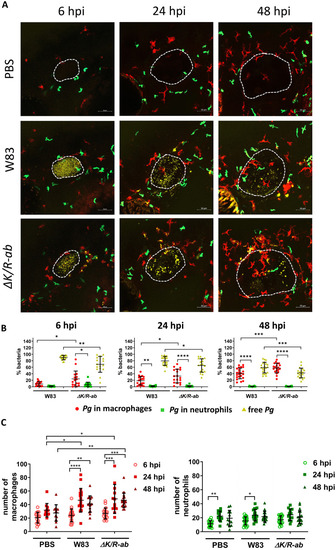
The role and migration of macrophages and neutrophils during local infection of Zebrafish larvae (30 hpf) were infected locally into the otic vesicle with AlexaFluor647–Se-labelled wild-type |