
- Title
-
Three different noggin genes antagonize the activity of bone morphogenetic proteins in the zebrafish embryo
- Authors
- Fürthauer, M., Thisse, B., and Thisse, C.
- Source
- Full text @ Dev. Biol.

Noggin1 expression at blastula and gastrula stages. (A) At sphere stage nog1 transcripts become detectable in the dorsal marginal region. (B) At 30% epiboly, nog1 is expressed in a 45° crescent at the dorsal margin. (C) With the beginning of gastrulation, nog1 is expressed in the leading cells of the involuting hypoblast. (D) Optical cross section at the level of the shield shows that nog1 expression is restricted to the mesendoderm. (E) At 60% epiboly, nog1 is expressed throughout the axial hypoblast with exception of the marginal region (arrowhead). (F) In the dorsal part of the embryo, bmp4 is expressed in the same territory as nog1. (G) At 75% epiboly, nog1 is expressed in prechordal plate and axial mesoderm. Marginal cells do not express nog1 (arrowhead). (H) At the end of gastrulation a transversal stripe of diffuse nog1 expression becomes detectable at the level of the anterior segmental plate (arrowheads). (I) An optical cross section at this level shows that the paraxial expression is hypoblastic. (A, C, E, F, G) Lateral view. (B) Animal pole view. (D) Transversal optical cross section at the level of the shield. (H) Dorsal view. (I) Optical cross section at the level of the prospective anterior segmental plate, dorsal is up. Unless indicated otherwise, dorsal is to the right. |

Noggin1 expression at segmentation and pharyngula stages. (A) Lateral view of a 6-somite stage embryo shows nog1 expression in the posterior eye field (black arrow), the somites as well as the unsegmented paraxial mesoderm (open arrowhead), the caudal floor plate (arrowhead), and the posterior tip of the notochord (star). (B) Optical cross section of the embryo at the level indicated by the white arrow in (A). Nog1 is expressed in the hypoblast at the level of the prospective pharyngeal endoderm. (C) Dorsal view of a 3-somite-stage embryo. Note that axial nog1 expression is vanishing at the level of the forming somites, while expression is still robust at more anterior or posterior levels. (D) Lateral view of a 12-somite-stage embryo. Nog1 becomes detectable in the dorsal neural tube from the diencephalon caudalward (arrowhead). Faint expression is still observed in the caudal floor plate (arrow). (E, F) At the 18-somite stage, nog1 is expressed in discrete dorsal and ventral aspects of the recently formed caudal somites (so). In older more anterior somites only nog1 is expressed only ventrally (white arrowheads). Caudally, nog1 is expressed in the dorsal spinal cord (arrow), the tip of the notochord (nc), and the mesenchyme lining the tail bud (black arrowhead). (G) At 24 h of development, somitic nog1 expression is restricted to the ventral part of the somites. (H, I) At 48 h of development lateral views show very restricted nog1 expression in the anterior ventral hindbrain (H) and the diencephalon (I). EXPRESSION / LABELING:
|

Expression of noggin2 during embryogenesis. (A) At the end of gastrulation, nog2 expression starts in the notochord. (B) At the 10-somite stage, nog2 is expressed in the telencephalon (te) and anterior diencephalon (di) as well as the tail bud (arrow). (C) At the 12-somite stage, nog2 transcripts are present in the antero-medial part of the somites. (D) At the 16-somite stage, additional nog2 expression is observed in the dorsal hinbrain at the level of rhombomere 2 and 4 (arrowheads), the dorsal aspect of the caudal spinal cord (open arrowhead), and the mesenchyme lining the tail bud (arrow). (E) At 20 h of development, nog2 expression is restricted to distinct dorsal and ventral aspects of the somite. (F) At 30 h of development, nog2 expression persists in the ventro-medial somite, but is no more detectable dorsally. (G) At 36 h of development, nog2 is expressed in the dorsal hindbrain walls. (H) At 48 h of development nog2 expression in the hindbrain becomes increasingly complex. (I) At 72 h of development, nog2 is expressed in numerous small cell populations in the head. (A, B) Lateral view, dorsal to the right. (C) Dorsal view, anterior to the left. (D) Lateral view, anterior to the left. (E, F) Transversal sections at tail level. (G) Transversal section at the level of the anterior hindbrain. (H) Dorsal view, anterior to the left. (I) Longitudinal optical cross section through the head. EXPRESSION / LABELING:
|

Noggin3 is expressed in forming cartilage elements. (A, B) nog3 expression becomes detectable at 48 h of development in the trabeculae cranii. (C) Transcripts are also detected in condensing cartilage cells at the tip of the pharyngeal arches. (D) In the pectoral fin, nog3 is expressed in cuboidal chondrocytes. (A) Lateral view, anterior to the left. (B) Same embryo as in (A), longitudinal optical cross section through the head at the level of the jaw; anterior is up. (C) Lateral view of the pharyngeal arches. (D) Lateral view of a pectoral fin. EXPRESSION / LABELING:
|

Overexpression of zebrafish noggin genes dorsalizes the embryo and induces the formation of a partial secondary axis. (A–D) 5-somite-stage embryos. (A, B, D) Dorsal view. (C) Ventral view. Compared to uninjected control embryos (A), embryos injected with 20 pg mRNA encoding nog1 (B) or nog2 (D) are ovoid and display enlarged somites. (C) In severely affected embryos the somites are fused on the ventral side. (E–G) Lateral view of 36-h-old embryos injected with 4 (E) or 10 pg (F, G) nog1 mRNA. Injection of increasing amounts of noggin leads to posterior truncations of increasing severity. (H–J) Localized misexpression of nog1 or nog2 in one blastomere at the 16-cell stage induces the formation of a partial secondary axis (arrowhead). (J) The secondary axis comprises rhombomeres 3 and 5 stained by krox20 and the midbrain–hindbrain boundary visualized by en3 expression but lacks a sonic hedgehog-expressing floor plate, which is present only in the primary axis (arrow). |

Analysis of noggin1-injected embryos with molecular markers. All injected embryos received 20 pg nog1 mRNA. (A–H) 5-somite-stage embryos, dorsal views except (D) posterior view and (F) frontal view. (A) Uninjected wild-type control embryo. (B–D) In situ hybridization with shh, MyoD, and krox20 shows that following nog1 misexpression paraxial MyoD expression is enlarged and even circularized. (E, F) Expression of en3 at the midbrain–hinbrain boundary (arrow) and krox20 in rhombomeres 3 and 5 (arrowheads) ventrally encircle the embryo following nog1 overexpression. (G) Overexpression of nog1 can induce an enlargement of the axial mesoderm as revealed by expansion of the sonic hedgehog expression domain (bracket), lined by adaxial MyoD-expressing cells (arrows). (H) In 7% of the embryos the shh domain is split into two stretches separated by MyoD-expressing adaxial cells. (I–L) Embryos at midgastrula stages stained with eve1, a marker of the ventral margin, and shh, expressed in the axial mesendoderm. (I, J) Vegetal view, dorsal to the right. Following nog1 overexpression the eve1 expression domain is very much reduced, whereas the shh territory appears expanded. (K, L) Dorsal view. Nog1 overexpression enlarges the shh expression domain. (M–P) Shield-stage embryos, dorsal to the right. (M, N) Animal pole view. Nog1 overexpression induces gsc expression all around the margin of the blastoderm. (O, P) Lateral view. Ectopic gsc expression is limited to the marginal hypoblast (arrowheads). |
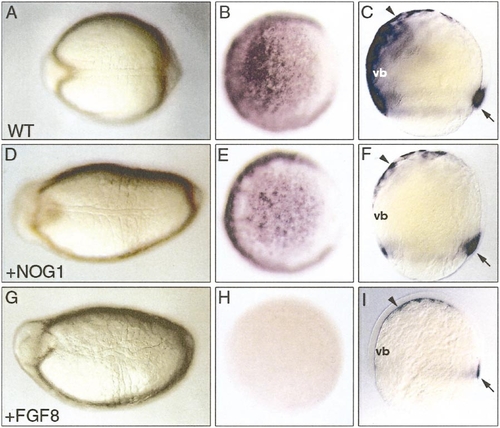
Noggin1 and fgf8 induce similar dorsalizations but have different effects on bmp2b expression. (A, D, G) Dorsal view of 5-somite-stage embryos, anterior to the left. (A) Uninjected control embryo. Both nog1 (D) overexpression and fgf8 (G) overexpression induce a dorsalization of the embryo, which displays an ovoid shape and enlarged somites. (B, E, H) Animal pole view of blastula-stage embryos, dorsal to the right. (B) bmp2b expression in a wild-type embryo. (E) bmp2b expression is still present following nog1 overexpression, whereas it is lost following fgf8 overexpression (H). (C, F, I) Lateral view of midgastrula-stage embryos, dorsal to the right. (C) In the wild-type embryo, bmp2b is expressed in the ventral blastoderm (vb), the ventral yolk syncytial layer (arrowhead), and the marginal zone (arrow). (F, I) Following nog1 or fgf8 overexpression, bmp2b expression is lost in the ventral blastoderm and maintained only in the ventral yolk syncytial layer and the marginal zone. |
Reprinted from Developmental Biology, 214(1), Fürthauer, M., Thisse, B., and Thisse, C., Three different noggin genes antagonize the activity of bone morphogenetic proteins in the zebrafish embryo, 181-196, Copyright (1999) with permission from Elsevier. Full text @ Dev. Biol.