
- Title
-
Neural degeneration mutants in the zebrafish, Danio rerio
- Authors
- Furutani-Seiki, M., Jiang, Y.J., Brand, M., Heisenberg, C.P., Houart, C., Beuchle, D., van Eeden, F.J.M., Granato, M., Haffter, P., Hammerschmidt, M., Kane, D.A., Kelsh, R.N., Mullins, M.C., Odenthal, J., and Nüsslein-Volhard, C.
- Source
- Full text @ Development
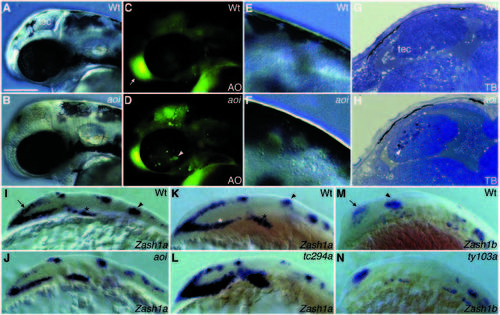
Class I mutant phenotypes. (A,C,E,G,I,K,M) Wild type; (B,D,F,H,J) aoi, (L) tc294a and (N) ty103a. (A-H) at 36 h; (I-L) at the 10- somite stage and (M,N) at the 15-somite stage. (C,D) Acridine orange (AO)-stained embryos of (A,B) respectively. (G,H) Parasagittal section of the tectum stained with toluidine blue. In situ hybridization with Zash 1a probe (I-L) and with Zash 1b probe (M,N). Apoptotic cells are indicated by white arrowheads. In aoi mutants apoptotic cells are present in the tectum (D,H arrowhead), cerebellar fold, dorsal hindbrain (F) and the neural retina (D arrowhead). Normal olfactory epithelium is stained with acridine orange (C, arrow). (I,J) The dorsal forebrain expression (arrow) and rhombomere 2 expression of Zash 1a (arrowhead) are reduced in aoi mutants whereas ventral midbrain expression (black star) is increased; (K,L) the ventral forebrain expression (white star), tegmentum expression (black star) are increased whereas the midbrain-hindbrain boundary expression of Zash 1a (arrowhead) is reduced in tc294a embryos; (M,N) the telencephalic expression of Zash 1b (arrow) is increased in contrast to the absence of its midbrain expression (arrowhead) in ty103a. Scale bar, approximately 100 µm in A-D and IN; 200 µm in E and F; 300 µm in G and H. EXPRESSION / LABELING:
|
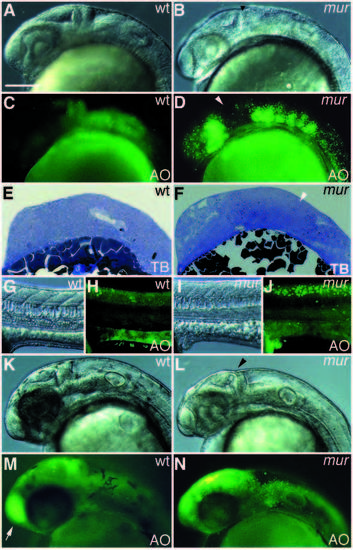
Class II mutant phenotypes. (A,C,E,G,H,K,M) Wild type embryos; (B,D,F,I,J,L,N) mur embryos. (A-J) at 24 hours, (K-N) at 36 hours. (C,D,H,J,M,N) Acridine orange (AO)-stained embryos of A,B,G,I,K,L, respectively. (E,F) Histological structure of the brain, as shown in parasagittal section. (A,B,K,L) Pointed midbrainhindbrain boundary (black arrowhead) is seen in mur embryos; (C,D) apoptotic cells are seen in parts of the forebrain, hindbrain and the spinal cord (H,J). The midbrain (white arrowhead in D) is less affected. (E,F) Toluidine blue stained apoptotic neuroepithelium is not seen in the midbrain (white arrowhead) in mur embryos; (K,L) small and less pigmented head of mur embryos; (M,N) apoptotic cells are seen in dorsal diencephalon and midbrain. Apoptotic cells in the hindbrain and the spinal cord are reduced. Acridine orange stained olfactory epithelium (white arrow in M) is reduced in mur embryos. Scale bar, 100 µm. |

Class III mutant phenotypes. (A,B,E,G) Wild type; (C,D,F,H) yug embryos. (A-F) at 36 hours, (G,H) at 60 hours. (B,D) Acridine orange staining of A and C, respectively. (E,F) Parasagittal section of the brain. (A,C) The brain appears normal except for the presence of degenerating cells in yug embryos. (B,D) Apoptotic cells exist throughout the brain including the neural retina (arrowhead); acridine orange (AO)-staining of the olfactory epithelium (arrow) is reduced in yug; toluidine blue stained apoptotic cells are seen in the tectum in yug. The apoptotic cells are in a clump (arrow). Viable cells in the tectum are less well stained in yug embryos compared to wild type. The neuroepithelium is not differentiated properly (E,F). The head and eyes are small in yug embryos (G,H). Scale bar, 100 µm. |

Class IV mutant phenotypes. (A,C,E,I) Wild type; (B,D,F,G,H,J) awa embryos. (A-H) at the 25-somite stage; (I,J) at 36 hours. (C,D) Acridine orange (AO)-staining of A and B, respectively. (E,F) Parasagittal section of the brain. (A-D) General apoptosis of neuroepithelium in the nervous system of awa; (E,F) toluidine blue (TB)-stained apoptotic cells (arrowhead) in awa. The rest of the cells in the neuroepithelium appear unaffected; (G,H) myotomes (myo), floor plate cells (arrow) and vacuolated cells of notochord (not) are relatively normal in awa embryos; (I,J) small and distorted head of awa embryos. The midbrain-hindbrain boundary (arrowhead), tectum and the fourth ventricle (arrow) are not well developed in awa embryos. Scale bar, 100 µm. PHENOTYPE:
|
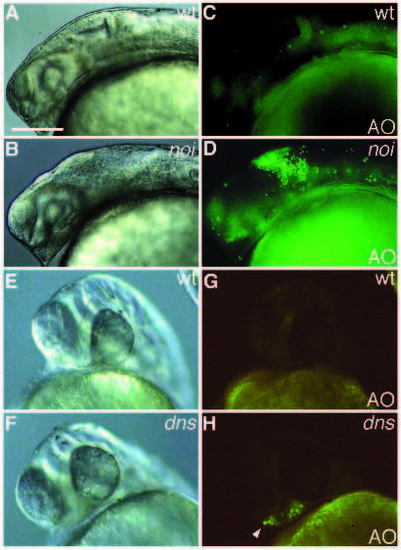
Mutants that show abnormaly localized apoptotic cells. (A,C,E,G) Wild type; (B,D) noi; (F,H) dns. (A-D) At 24 h; (E-H) at 36 hours. (A-D) Localized apoptotic cells are seen in the presumptive isthmus in noi (arrowhead); (E-H) restricted apoptotic cells are detected in the anterior prechodal plate in dns embryos (arrowhead). Scale bar, 100 µm. |
