
- Title
-
Expression of zebrafish goosecoid and no tail gene products in wild-type and mutant no tail embryos
- Authors
- Schulte-Merker, S., Hammerschmidt, M., Beuchle, D., Cho, K.W., De Robertis, E.M., and Nüsslein-Volhard, C.
- Source
- Full text @ Development

Early and late phases of zygotic gsc expression are revealed by Northern analysis. The respective stages are indicated at the top, the lower panel displays 28S rRNA as a loading control. Zygotic transcription commences at 3-4 hours, peaks at 50-100% epiboly, and decreases during early somitogenesis. An independent phase of gsc transcription can be observed starting from 36 hours of development. Weak gsc expression can be seen in RNA from ovary and adult females after longer exposures. |

Expression of zebrafish gsc during gastrulation. Dorsal is to the right except in B, D, E and H, which are animal pole views. Lateral view (A) and animal pole view (B) of a 3.5-hour-old blastula embryo; note the graded distribution of gsc transcripts. In an embryonic shield stage embryo (C), gsc is exclusively expressed in the first involuting cells at the dorsal side. Dorsal convergence at this stage leads to an accumulation of gsc-expressing cells in the hypoblast of the dorsal midline (E), leading to a thinning-out of gsc signal in the more lateral region, if compared to a slightly earlier stage (D; 40% epiboly). At 75% epiboly (F), gsc-expressing cells are at the leading edge of the dorsal hypoblast. (G,H) Lateral and animal pole views of the same embryo (tailbud stage, 10 h). There is strong staining in cells of the prechordal plate, with an arrowhead-shaped widening at the anterior most end of the hypoblast. One hour later (I), in a 2-somite embryo, staining in the dorsal midline has decreased in intensity, but there are still cells expressing high levels of gsc at the anterior tip of the hypoblast. EXPRESSION / LABELING:
|

Late phase of gsc expression in the larval head. In situ hybridizations demonstrating gsc expression in the head region of a 2-day-old (A,B) and 3-day-old embryo (C,D). (A,C) Dorsal views; (B,D) lateral views. There is strong staining in Meckel’s cartilage (mc), the mandibular (m) and the hyoid arch, as well as in other regions. EXPRESSION / LABELING:
|
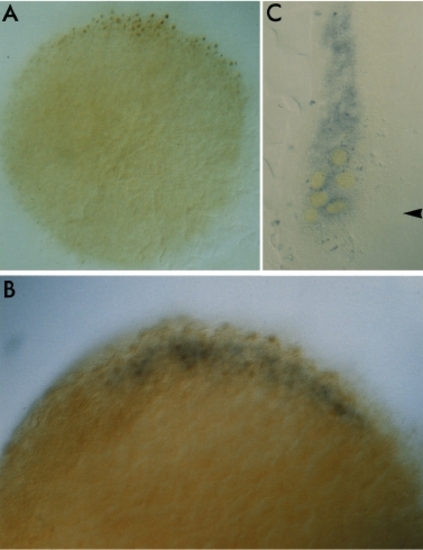
Ntl protein expression starts at the dorsal side of the late blastula. (A) Blastula (4.0 h, animal pole view) stained with an antiserum raised against the Ntl protein shows asymmetrical distribution at the margin. (B) Double staining of gsc RNA (blue) and Ntl protein (brown) demonstrates that Ntl protein is expressed first at the dorsal side of the zebrafish blastula (animal pole view). (C) Histological section through the dorsal margin of an embryonic shield stage embryo after double staining as in (B) shows that some cells, but not all, express both gsc RNA (blue) in the cytoplasm and Ntl protein (yellow) in the nucleus. The arrowhead marks the epiblast. |

The gsc and ntl-expressing regions resolve into two distinct cell populations in the course of gastrulation. In situ hybridizations revealing gsc message (blue), combined with antibody stainings showing the distribution of Ntl protein (brown). Two different magnifications of a 60% epiboly (A,B) and a 90% epiboly embryo (C,D) are shown, each one in a dorsal view. The pictures demonstrate overlap of gsc and ntl expression early during gastrulation, while 2 hours later the domains of expression have separated. The whole-mount preparations were dissected and flattened for photography. EXPRESSION / LABELING:
|

gsc RNA is expressed normally in ntl mutant embryos. Double labellings such as those in Fig. 6 were performed with 95% epiboly embryos from a ntlb160/+ x ntlb160/+ cross. All embryos showed gsc staining, while a quarter of the embryos exhibited absence of Ntl protein. (A) Embryo showing gsc staining in the prechordal plate and Ntl staining in notochord nuclei; note that the two regions of expression do not overlap. (B) Homozygous mutant embryo lacking Ntl protein; note that the posterior border of expression of gsc is entirely normal. EXPRESSION / LABELING:
|

Unillustrated author statements |