
- Title
-
Single-cell transcriptome reveals insights into the development and function of the zebrafish ovary
- Authors
- Liu, Y., Kassack, M.E., McFaul, M.E., Christensen, L.N., Siebert, S., Wyatt, S.R., Kamei, C.N., Horst, S., Arroyo, N., Drummond, I.A., Juliano, C.E., Draper, B.W.
- Source
- Full text @ Elife
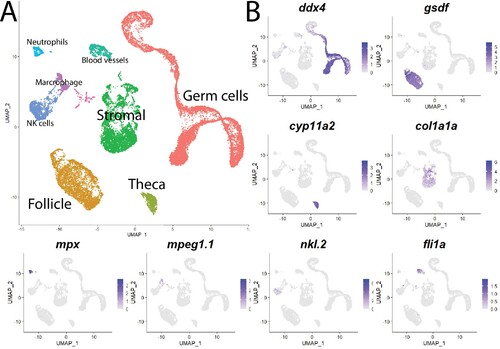
(A) Single-cell uniform manifold approximation and projection (UMAP) plot of the 40-day-old zebrafish ovary. Cells are color-coded by computationally determined cell clusters. (B) Gene expression plots of known cell-specific marker genes identify the major cell type (labeled in A) that each cluster corresponds to. Cells expressing the indicated gene are colored purple, and the relative intensity indicates relative expression levels (intensity scale for each plot is on the right).
|
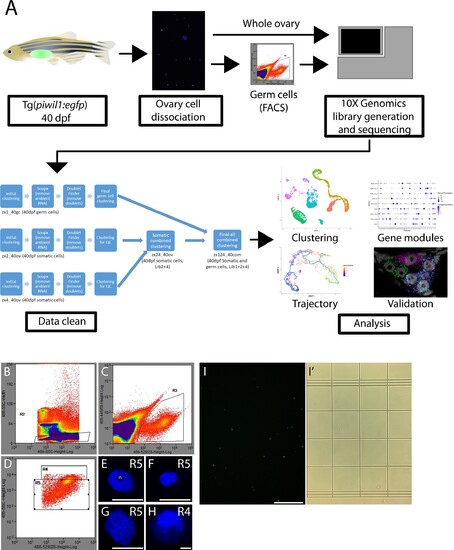
(A) Experimental pipeline for the production of the single-cell RNA-seq library. Briefly, 40-day post-fertilization (dpf) ovaries were isolated from Tg(piwil1:egfp) zebrafish and dissociated to single cells using two dissociation methods. The whole ovary dissociation method favored dissociation of somatic cells but led to loss of germ cells. A less stringent method was used to dissociate germ cells from somatic cells, followed by purification of germ cells by fluorescent-activated cell sorting (FACS). (B–D) FACS pseudocolor scatter plots with gating overlays. (B) The R2 gate selected for GFP+ single cells based on GFP fluorescence intensity (X-axis) and side scatter to measure cell size (Y-axis). (C) The R3 gate selected for GFP signal (X-axis) relative to cell autofluorescence (Y-axis). The R4 and R5 gates selected for cell size (Y-axis) and GFP signal (X-axis). The R5 gate contained smaller cells that were likely premeiotic, meiotic and early-stage oocytes, while R4 gate selected for larger cells that were likely more advanced oocytes. (E–H) Representative images of DAPI-stained nuclei from cells obtained from either the R5 (E–G) or R4 gates. (E) The prominent single nucleolus (n) contained within this nucleus is indicative of a premeiotic germ cell. (F, G) The diffuse chromatin in these nuclei is characteristic of premeiotic oocyte progenitor cells. (H) The presence of condensed and synapse chromosomes is characteristic of cells that have entered meiosis. Note that the nucleus in (H) is 30 µm in diameter while those in (E, F) are between 7 and 10 µm in diameter. Scale bars 10 µm. (I, I’). Fluorescence (I) or bright-field (I’) micrographs of GFP+ cells obtained from gate 5. Scale bars, (E–H) 10 µm; (I, I’) 250 µm.<
|
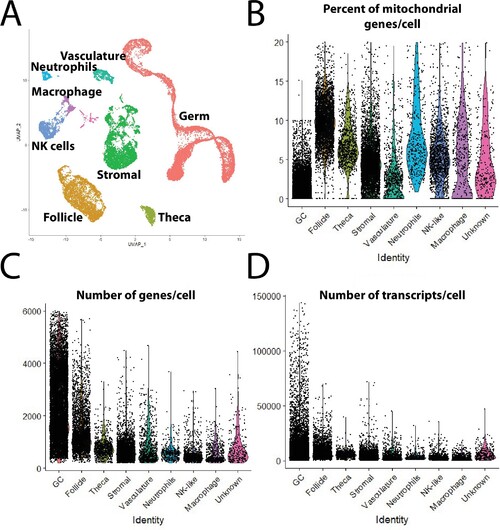
(A) Single-cell uniform manifold approximation and projection (UMAP) plot of 40-day-old zebrafish ovary with combined clusters based on major cell types. (B–D) Violin plot of percent of mitochondria genes (B), number of genes per cell (C), and number of transcripts per cell (D), in each major cell type in the final dataset.<
|

(A) Gene expression heatmap of differentially expressed genes between major cell types. Yellow represents highly expressed genes, purple represents lowly expressed genes, and black represents no expression. (B) Top 5 marker genes computationally identified in each major cell type based on statistical significance. |
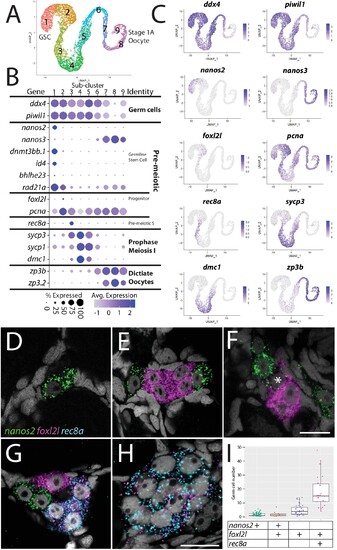
(A) Germ cell subcluster uniform manifold approximation and projection (UMAP) plot, with cells color-coded by computationally determined cell subtypes. (B) Dot plot showing the relative expression of select genes in the germ cell subclusters. Some genes, like ddx4 and piwil1, are expressed in all germ cells, while others, such as nanos2 or rec8a, are only expressed in distinct subclusters. (C) Gene expression UMAP plots of select genes. (D–H) Triple hybridization chain reaction RNA fluorescent in situ hybridization (HCR RNA-FISH) for nanos2 (green), foxl2l (magenta), and rec8a (blue) in 40-day-old zebrafish whole-mount ovary. Asterisk in (F) indicates a cell double-positive for nanos2 and foxl2l. (I) Cell number quantification of individual cysts that express the genes indicated on Y-axis. n = 70, N = 3. Scale bar in (F), for (D–G) 10 µm; in (H) 10 µm. |
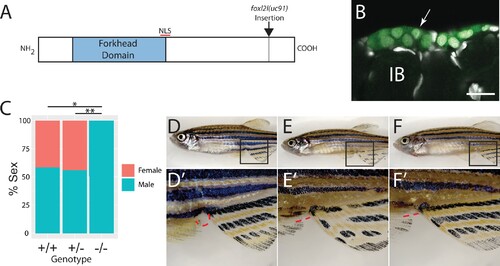
(A) Schematic diagram of the Foxl2l protein showing the DNA-binding forkhead homology domain (blue), the location of the nuclear localization signal (NLS), and the viral-2A-egfp insertion site in the foxl2l(uc91) allele. (B) GFP expression in germ cells from a foxl2l(uc91) knock-in allele heterozygote recapitulates endogenous foxl2l expression (compare to Figure 2E and F). (C) Sex ratios of foxl2l(uc91) heterozygotes and homozygotes. (D–F) Representative light micrographs of fish examined in (C) (n = 274, N = 4, *p=1 × 10⁻⁷, **p=2 × 10⁻⁷). Wild-type adult female zebrafish (D) has characteristic light-yellow pigmentation on ventral belly and a prominent anal papilla (highlighted with red dashed lines) (D’). (E) Wild-type adult male zebrafish (E) has dark yellow pigmentation on ventral belly and lacks an anal papilla (highlighted with red dashed lines) (E’). foxl2l(uc91) homozygous mutant (F) is phenotypically male. IB, stage IB oocyte.
|
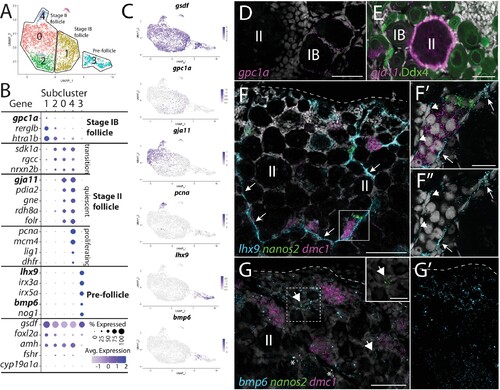
(A) Follicle cell subcluster uniform manifold approximation and projection (UMAP) plot, with cells color-coded by computationally determined cell subtypes. The three main subtypes are outlined. (B) Dot plot showing the relative expression of select genes in the follicle cell subclusters. Some genes, like gsdf, are expressed in all follicle cells, while others, such as lhx9, are only expressed in distinct subclusters. (C) Gene expression UMAP plots of select genes. Cells expressing the indicated gene are colored purple, and the relative intensity indicates relative expression levels (intensity scale for each plot is on the right). (D–G) Hybridization chain reaction RNA fluorescent in situ hybridization (HCR RNA-FISH) on whole-mount 40-day post-fertilization (dpf) ovaries reveals the location of cell subtypes. In all panels, DNA is gray. (D) gpc1a expression (pink) is detected in follicle cells surrounding stage IB oocytes, but not stage II oocytes. (E) gja11 expression (pink) is detected in follicle cells surrounding stage II oocytes, but not stage IB oocytes. Ddx4 indirect immunofluorescence (green) labels all germ cells. (F) Triple HCR RNA-FISH shows lhx9-expressing cells (blue) form tracts on the surface of the ovary (arrows) that colocalize with nanos2 (green) and dmc1 (pink)-expressing germline stem cells and early meiotic cells, respectively. Lateral edge of the ovary is indicated with a dashed line. (F’, F”) Higher-magnification views of regions boxed in (F) showing that lhx9+ cells (arrows) surround the germ cells. (G) Triple HCR RNA-FISH shows bmp6-expressing cells (blue) are concentrated near the lateral edge of the ovary, a region that contains nanos2 (green) and dmc1 (pink)-expressing germline stem cells (arrows) and early meiotic cells, respectively (inset in G shows nanos2 and DNA only for dashed boxed region). Asterisks identify autoflorescent red blood cells. (G’) bmp6 channel only. Scale bars in (D, E, G) for (G, G’) 50 µm; (F) 100 µm; (F’) (for F’ and F”) and (G, inset), 20 µm. IB, stage IB oocyte; II, stage II oocyte.
|
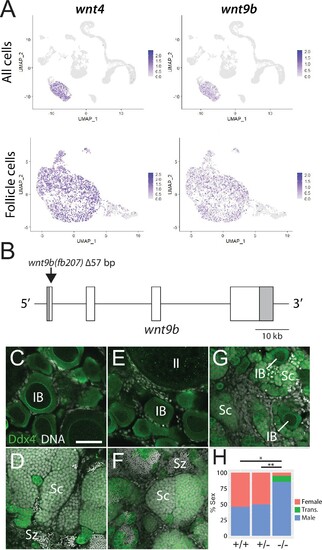
(A) Expression plots of wnt4a and wnt9b show that wnt9b is expressed only in follicle cells, in a pattern nearly identical to wnt4a. (B) Schematic of the wnt9b genomic locus. Boxes are exons, UTR sequences are shaded. Arrow indicates approximate location of the 57 bp deletion in the wnt9b(fb207) allele. (C–G) Representative regions of gonads stained for Ddx4 protein (green) to identify germ cells. wnt9b(+/+) ovaries (C) and testis (D). wnt9b(-/-) ovary (E) and testis (F). (G) wnt9b(-/-) gonad that contains mostly germ cells that have characteristics of spermatogenesis, but also has a few stage IB oocytes. (H) Sex ratios of offspring produced from wnt9b(fb207) heterozygous (+/-) parents (n = 384, N = 3, *p=0.016, **p=0.037). Trans., transitioning; IB, Stage IB oocyte; Sc, spermatocyte; Sz, spermatozoa. Scale bar in (C) for (C–G) 50 µm.
|
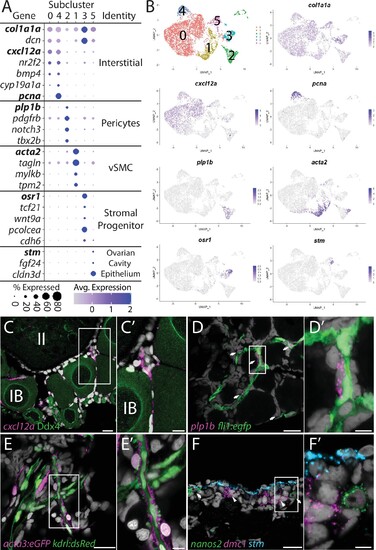
(A) Dot plot showing the relative expression of select genes in the stromal cell subclusters. Some genes, like col1a1a, are expressed in all stromal cells, while others, such as stm, are only expressed in a specific subcluster. Uniform manifold approximation and projection (UMAP) plots of genes in bold are shown in (B). Gene expression UMAP plots of select genes. Top-left panel shows cells color-coded by computationally determined cell subtype. Cells expressing the indicated gene are colored purple, and the relative intensity indicates relative expression levels (intensity scale for each plot is on the right). (C–G) Hybridization chain reaction RNA fluorescent in situ hybridization (HCR RNA-FISH) on whole-mount 40-day post-fertilization (dpf) ovaries reveals the location of cell subtypes. In all panels, DNA is gray. (C) cxcl12a-expressing interstitial cells localize around early-stage oocytes (≤stage IB), but not around stage II oocytes. Ddx4 indirect immunofluorescence (green) labels all germ cells. (C’) Higher magnification of the region boxed in (C). (D) plp1b- expression pericytes colocalize with fli1:egfp-expressing blood vessels (green). (D’) Higher magnification of region boxed in (D). (E). acta3:egfp expression vascular smooth muscle cells (red) surround kdrl:dsRed expression blood vessels (green). (E’) Higher magnification of the region boxed in (E). (F) stm (blue)-expressing cells localize to the lateral margin of the ovary and colocalize with nanos2 (green) and dmc1 (pink) germline stem cells and early meiotic cells, respectively. (F’) Higher magnification of the region boxed in (F). Scale bar in (C–E) 20 µm; (C’) 10 µm, (D’, E’, F’) 5 µm. IB, stage IB oocyte; II, stage II oocyte.
|
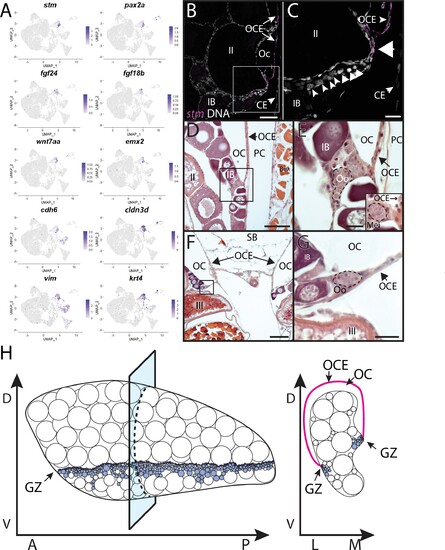
(A) Gene expression uniform manifold approximation and projection (UMAP) plots for select genes whose expression is enriched in stromal cell subcluster 3. (B) Hybridization chain reaction RNA fluorescent in situ hybridization (HCR RNA-FISH) on transverse sections from a 3-month-old ovary showing that stm (magenta) is expressed in the epithelium that lines the ovarian cavity (OC). DNA is gray. (C) Higher magnification of region boxed in (B) showing that early-stage germ cells localize to the region subjacent to where the OCE is attached to the lateral side of the ovary (arrowhead). (D, E) Histological transverse sections from a 3-month-old ovary showing correlation between where the OCE attaches to the ovary at the lateral (D, E) and medial (F, G) sides, and the presence of premeiotic germ cells, characterized by large, dark staining nucleoli, and early meiotic germ cells, characterized by condensed chromosomes (inset in E). (E) and (F) are higher-magnification views of regions boxed in (D) and (F), respectively. PC, peritoneal cavity; CE, coelomic epithelium; SB, swim bladder; Oo, premeiotic oogonia; Mei, early meiotic germ cell; IB, stage IB oocyte; III, stage III oocyte. Scale bar in (C, E, G) 10 µm; (B) 100 µm; (D) 200 µm; (F) 250 µm.
|
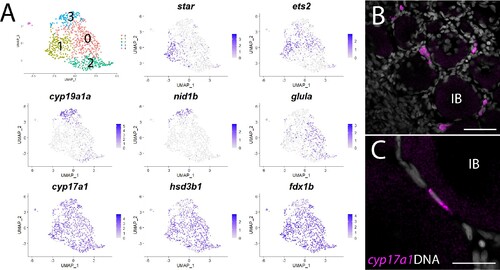
(A) Gene expression uniform manifold approximation and projection (UMAP) plots of select genes. Top-left panel shows cells color-coded by computationally determined cell subtype. Cells expressing the indicated gene are colored purple, and the relative intensity indicates relative expression levels (intensity scale for each plot is on the right). (B) Hybridization chain reaction RNA fluorescent in situ hybridization (HCR RNA-FISH) on whole-mount 40-day post-fertilization (dpf) ovaries reveals the location of cyp17a1-expressing theca cells. DNA is gray. (C) Higher magnification of cyp17a1-expressing theca cells. IB, stage IB oocyte. Scale bars in (B) 50 µm and (C) 20 µm.
|
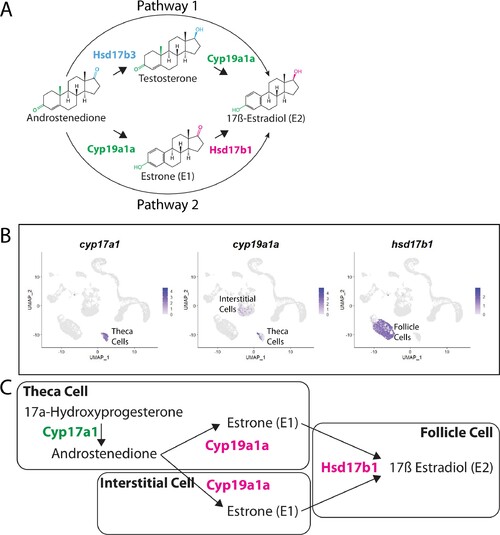
(A) Two possible pathways for E2 synthesis starting with androstenedione. Colors correspond to the region of the molecules being modified and to the enzyme that catalyzes the modification. (B) Gene expression uniform manifold approximation and projection (UMAP) plots of select genes. Top-left panel shows cells color-coded by computationally determined cell subtype. Cells expressing the indicated gene are colored purple, and the relative intensity indicates relative expression levels (intensity scale for each plot is on the right). (C) Proposed pathway for E2 synthesis in the zebrafish ovary, starting with the 17a-hydroxyprogesterone intermediate precursor, together with the cell types where each reaction occurs.
|