FIGURE SUMMARY
Title

miR-29b-3p Inhibitor Alleviates Hypomethylation-Related Aberrations Through a Feedback Loop Between miR-29b-3p and DNA Methylation in Cardiomyocytes

Authors
Wu, F., Yang, Q., Mi, Y., Wang, F., Cai, K., Zhang, Y., Wang, Y., Wang, X., Gui, Y., Li, Q.
Source
Full text @ Front Cell Dev Biol

ZFIN is incorporating published figure images and captions as part of an ongoing project. Figures from some publications have not yet been curated, or are not available for display because of copyright restrictions.

ZFIN is incorporating published figure images and captions as part of an ongoing project. Figures from some publications have not yet been curated, or are not available for display because of copyright restrictions.

Correlations between the mRNA expression of DNMTs and miR-29b-3p in patients with CHD. (A) The correlation between DNMT1 and miR-29b-3p expression (r = −0.5137, p = 0.0349). (B) The correlation between DNMT3A and miR-29b-3p expression (r = −0.5123, p = 0.0355). (C) The correlation between DNMT3B and miR-29b-3p expression (r = −0.6012, p = 0.0107). Spearman’s correlation tests were used.

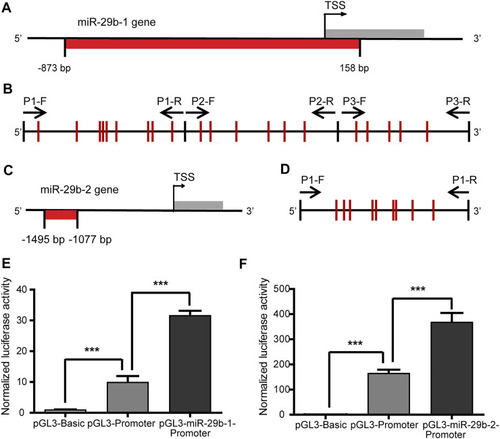
Transcriptional regulatory activity of the miR-29b-1 and miR-29b-2 gene promoters. (A) The location of the CpG sites in the promoter region of the miR-29b-1 gene (−873 bp to +158 bp). (B) The distribution of the CpG sites and three pairs of primers designed for bisulfite sequencing PCR in the promoter region of the miR-29b-1 gene. (C) The location of the CpG sites in the promoter region of the miR-29b-2 gene (−1495 bp to −1077 bp). (D) The distribution of the CpG sites and the primers designed for bisulfite sequencing PCR in the promoter region of the miR-29b-2 gene. (E) The effect of the −873 bp to +158 bp region on the regulation of miR-29b-1 gene promoter transcriptional activity. (F) The effect of the −1407 bp to -1173 bp region on the regulation of miR-29b-2 gene promoter transcriptional activity (***p < 0.001).

Association of miR-29b-3p expression with its methylation status in eight patients with CHD. (A and B) Methylation status of the promoter region of the miR-29b-1 gene and miR-29b-2 gene. The black and white circles represent methylated and unmethylated CpG dinucleotides, respectively. (C) Correlations between miR-29b-3p expression and the methylation status of the miR-29b-1 gene (r = −0.7074, p = 0.0497, and N = 8). (D) Correlations between miR-29b-3p expression and the methylation status of the miR-29b-2 gene (r = −0.4895, p = 0.2182, and N = 8). (E) Correlations between miR-29b-3p expression and the methylation status of CpG 7 located in the miR-29b-2 gene (r = −0.7236, p = 0.0425, and N = 8). (F) Correlations between miR-29b-3p expression and the methylation status of CpG 8 located in the miR-29b-2 gene (r = −0.7124, p = 0.0474, and N = 8). Spearman’s correlation tests were used.

The effect of promoter hypermethylation on the expression of miR-29b-3p. (A and B) The methylation levels of the pGL3-miR-29b-1 promoter and pGL3-miR-29b-2 promoter before M. SssI treatment. For each plasmid, the methylation status of CpG units is shown for ten clones. Black and white circles indicate the methylated and unmethylated CpG units, respectively. (C and D) The methylation levels of the pGL3-miR-29b-1 promoter and pGL3-miR-29b-2 promoter after M. SssI treatment. (E) The effect of methylation on the transcriptional activity of the −873 bp to +158 bp region of the miR-29b-1 gene. (F) The effect of methylation on the transcriptional activity of the −1407 bp to −1173 bp region of the miR-29b-2 gene. (ns not significant, *p < 0.05, **p < 0.01, ***p < 0.001, and ****p < 0.0001).

Identification of miR-29b methylation level and mRNA expression after exposure to 5-azacytidine or decitabine. (A and B) The methylation level of miR-29b-1 and miR-29b-2 in additional samples from the control (n = 3), 5-Aza (n = 5) and decitabine (n = 3) groups analyzed by targeted bisulfite sequencing. (C) miR-29b-3p expression in HL1 cells after exposure to 5-azacytidine at 25 µM or decitabine at 20 µM. p-values were calculated by one-way ANOVA. ns not significant; *p < 0.05; **p < 0.01; ***p < 0.001; and ****p < 0.0001.

The effect of miR-29b-3p on the expression of DNMTs. (A and B) The predicted binding site of miR-29b-3p in the 3′ untranslated regions of DNMT3A and DNMT3B. (C and D) The relative luciferase activity of HL1 cells cotransfected with miR-29b-3p mimic or NC mimic and plasmid containing DNMT3A or 3B wild-type or mutated 3′UTRs. (miR-29b-3p mimic + psiCHECK™-2-DNMT3A/3B-3′UTR vs. NC mimic + psiCHECK™-2-DNMT3A/3B-3′UTR, ***p < 0.001; miR-29b-3p mimic + psiCHECK™-2-DNMT3A/3B-3′UTR-MUT vs. NC mimic + psiCHECK™-2-DNMT3A/3B-3′UTR-MUT, p = ns). (E) mRNA expression of DNMTs in HL1 cells transfected with miR-29b-3p mimic or its inhibitor (miR-29b-3p mimic vs. NC, *p < 0.05, miR-29b-3p inhibitor vs. NC inhibitor, ***p < 0.001). (F) Protein expression of DNMTs in HL1 cells transfected with miR-29b-3p mimic or its inhibitor. (G) Relative quantification of DNMT proteins (ns not significant, *p < 0.05, **p < 0.01 and ***p < 0.001).

The impact of miR-29b-3p inhibitor on the overall development of hypomethylated zebrafish embryos. (A) miR-29b-3p inhibitor partially reduced the mortality and deformity rates of zebrafish that resulted from 5-azacytidine exposure (n > 100). (B–D) The zebrafish general development score of the miR-29b-3p inhibitor group was significantly better than that of the NC inhibitor group at 48 hpf and 72 hpf (n > 50). (E and F) The heart rate and fractional shortening of zebrafish embryos coinjected with 5-azacytidine and miR-29b-3p inhibitor displayed no significant difference from those of the 5-azacytidine and NC inhibitor groups (n = 20).

The proliferation ability of hypomethylated cardiomyocytes transfected with miR-29b-3p inhibitor. (A–C) Cell proliferation ability detected by a CCK-8 assay at 24, 48 and 72 h (D–F) The cell proliferation ability detected by an EdU incorporation assay at 24, 48 and 72 h. (G) Representative images of HL1 cells stained with EdU and Hoechst (0 μM, 5 μM, and 25 µM represent 3 concentrations of 5-azacytidine; miR-29b-3p inhibitor vs. NC inhibitor, ns not significant, *p < 0.05, **p < 0.01, ***p < 0.001, and ****p < 0.0001).

Acknowledgments
This image is the copyrighted work of the attributed author or publisher, and ZFIN has permission only to display this image to its users. Additional permissions should be obtained from the applicable author or publisher of the image. Full text @ Front Cell Dev Biol