Overview of this study.

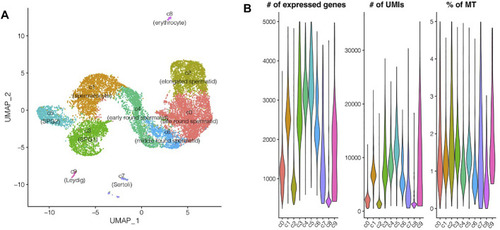
Single cell RNA sequencing of zebrafish testes. (A) UMAP representation of 10 cell populations. (B) Violin plots for the distribution of the number of expressed genes, UMIs, and the percentage of mitochondrial UMIs.

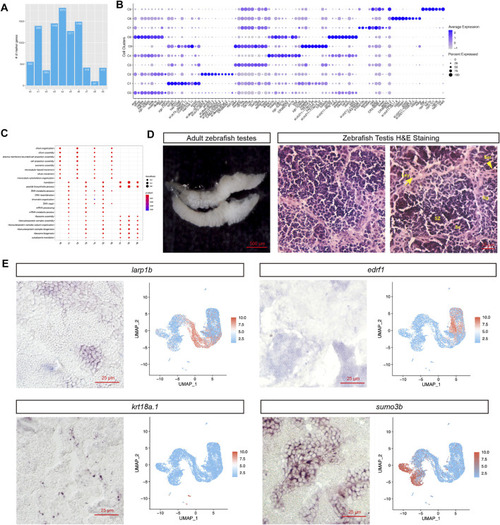
Studies of novel marker genes for each cell population. (A) Distribution of the number of marker genes in each cell population. (B) Dotplot visualization of top 10 marker genes for each cell cluster. (C) GO term enrichment analysis of the marker genes. (D) H&E staining of different cell types (Ser, Sertoli cell; Sg, Spermatogonia; Sc, Spermatocyte; SZ: spermatozoa; Ley: Leydig cell). (E) RNA in situ hybridization of novel marker genes. (For each marker gene, both of the ISH experimental result (Left) and scRNA-seq UMAP representation of gene expression were presented (Right))

EXPRESSION / LABELING:
Genes:
Fish:
Anatomical Terms:
Stage: Adult

Comparative study of SPG1 and SPG2. (A) Distribution of the number of genes enriched in SPG1 or SPG2. (B) Heatmap visualization of top 10 marker genes. (C) GO term enrichment analysis of the enriched genes. (D) RNA in situ hybridization result for SPG2 specifically expressed gene hist1h4l.6.

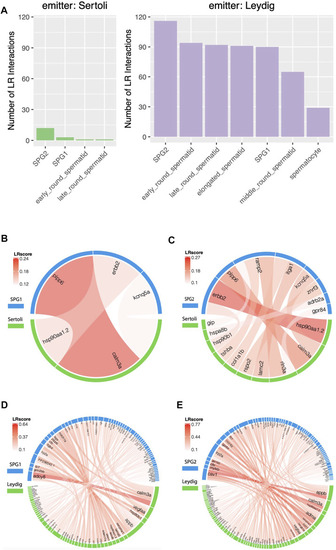
Comparative studies of paracrine influence of Leydig and Sertoli cells. (A) Summary of the Ligand-Receptor (LR) interactions between somatic and germ cells. (B) LR interaction chord diagram for the influence of Sertoli cells on SPG1. (C) LR interaction chord diagram for the influence of Sertoli cells on SPG2. (D) LR interaction chord diagram for the influence of Leydig cells on SPG1. (E) LR interaction chord diagram for the influence of Leydig cells on SPG2.

Acknowledgments
This image is the copyrighted work of the attributed author or publisher, and ZFIN has permission only to display this image to its users. Additional permissions should be obtained from the applicable author or publisher of the image. Full text @ Front Genet