
- Title
-
Loss of zebrafish dzip1 results in inappropriate recruitment of periocular mesenchyme to the optic fissure and ocular coloboma
- Authors
- Nandamuri, S.P., Lusk, S., Kwan, K.M.
- Source
- Full text @ PLoS One
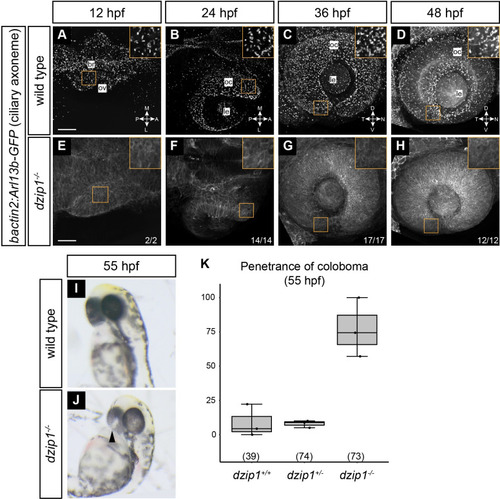
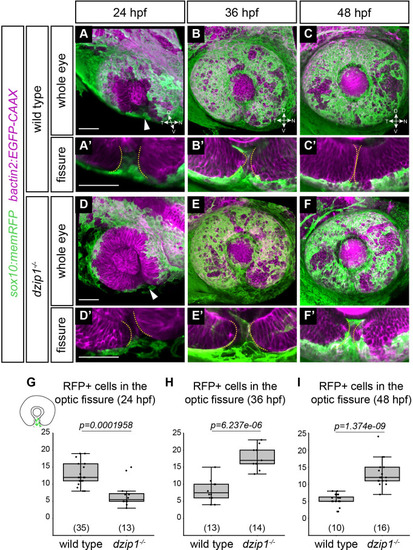
(A-H) Wild type (A-D) and EXPRESSION / LABELING:
PHENOTYPE:
|

(A-P) Wild type (A-D, I-L) and EXPRESSION / LABELING:
PHENOTYPE:
|
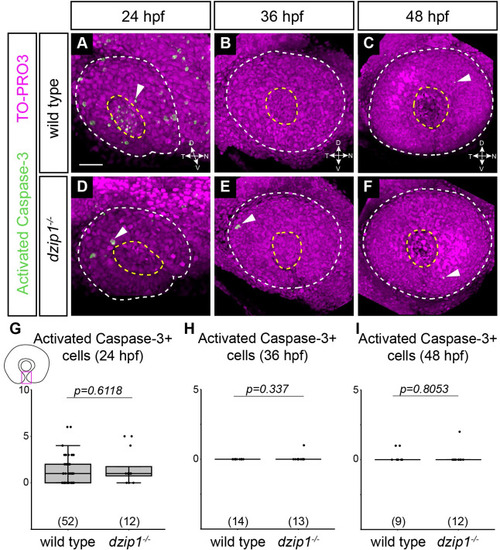
(A-F) Whole mount immunofluorescence in wild type (A-C) and |
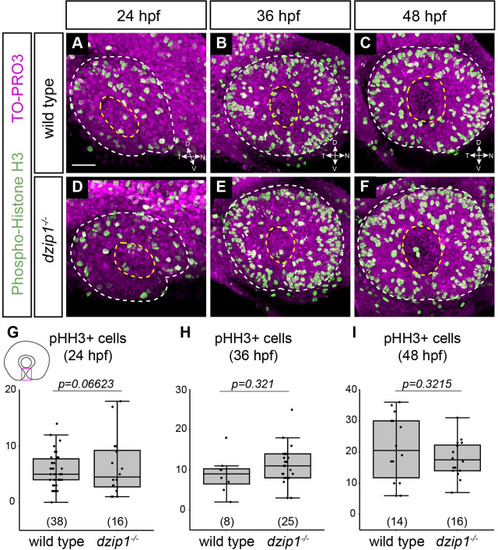
(A-F) Whole mount immunofluorescence in wild type (A-C) and |
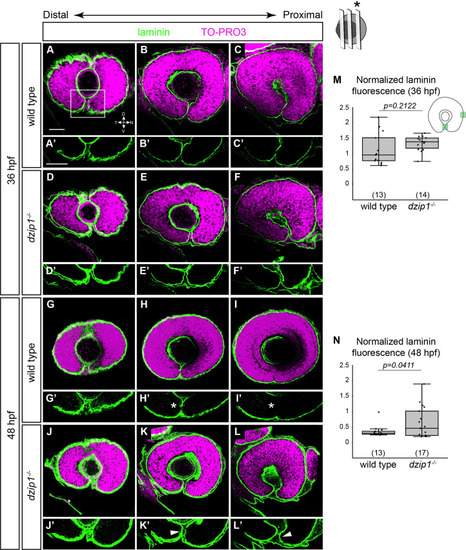
(A-L) Whole mount immunofluorescence for Laminin ( |
Embryos visualized for neural crest ( |
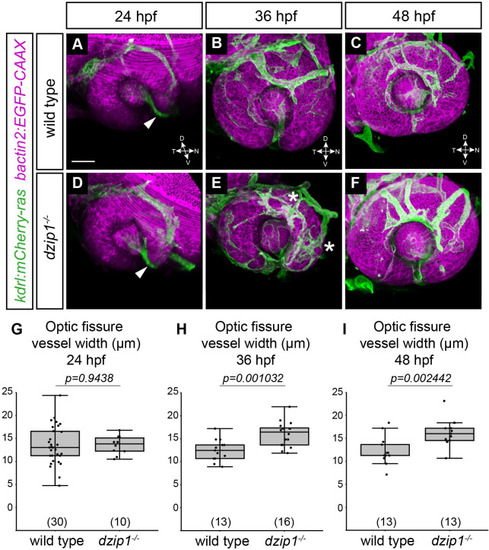
(A-F) Embryos visualized for endothelial cells ( |
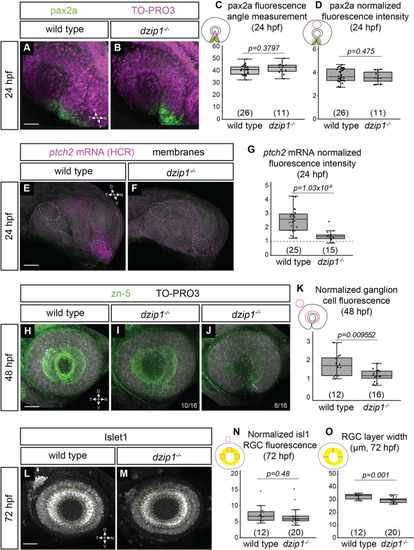
(A-B) Whole mount immunofluorescence for pax2a ( EXPRESSION / LABELING:
PHENOTYPE:
|