
- Title
-
mTOR activity is essential for retinal pigment epithelium regeneration in zebrafish
- Authors
- Lu, F., Leach, L.L., Gross, J.M.
- Source
- Full text @ PLoS Genet.
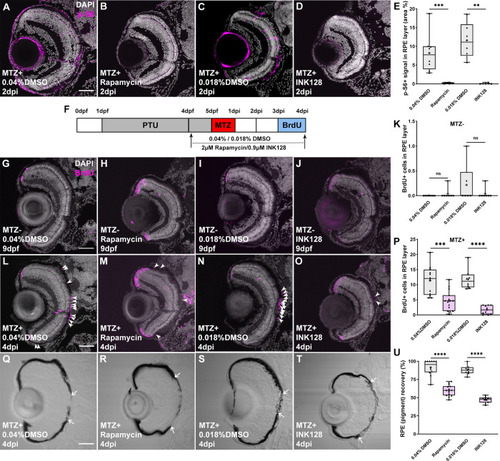
(A-D) Immunofluorescent images of p-S6 staining on transverse cryosections from MTZ+ DMSO-, rapamycin- or INK128-treated larvae at 2dpi. Nuclei (white), p-S6 (magenta) (E) p-S6 levels in the RPE layer were significantly decreased in rapamycin-treated and INK128-treated larvae when compared with DMSO-treated controls. (F) Schematic of the experimental paradigm showing the timeline for chemical treatments and ablation. (G-J) Immunofluorescent images of BrdU staining on transverse cryosections from MTZ- DMSO-, rapamycin- and INK128-treated larvae at 9dpf and (L-O) from MTZ+ DMSO-, rapamycin- or INK128 -treated larvae at 4dpi. |
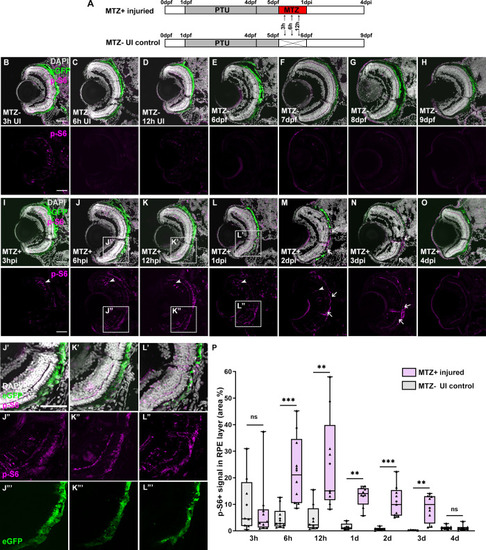
(A) Schematic of the experimental paradigm showing the time points for MTZ ablation and sample collection on transgenic larvae ( |
(A,B) Immunofluorescent images of p-S6 staining on transverse cryosections from ablated |
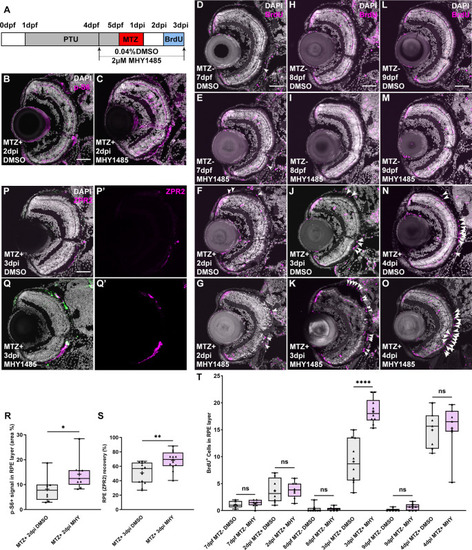
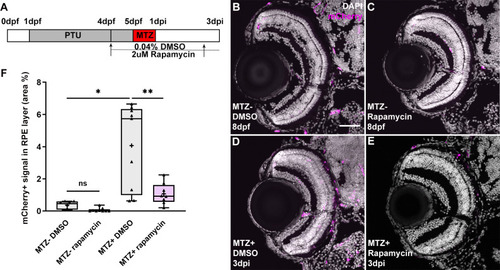
(A) Schematic of the experimental paradigm showing the timeline for chemical treatments and ablation. (B,C) Immunofluorescent images of p-S6 staining on transverse cryosections from MTZ+ DMSO- and MHY1485-treated larvae at 2dpi. Nuclei (white), p-S6 (magenta). (R) Quantification of p-S6 signal in the RPE layer showed a significant increase of p-S6 levels in MHY1485-treated larvae when compared to DMSO-treated controls. (D-O) Fluorescent images of BrdU immunostaining on cryosections from MTZ- and MTZ+ DMSO- and MHY1485-treated larvae at (D-G) 7dpf/2dpi, (H-K) 8dpf/3dpi and (L-O) 9dpf/4dpi. |
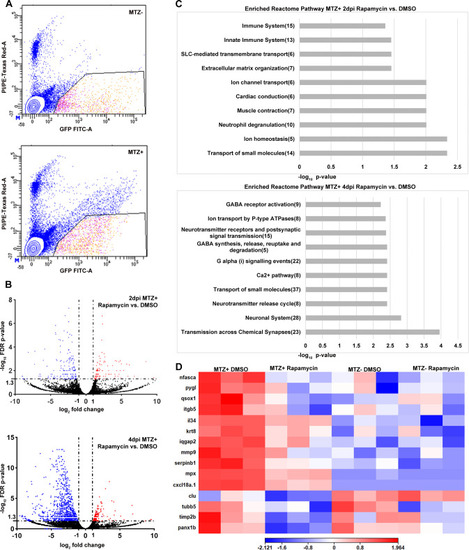
(A) Representative FACS plots from MTZ- and MTZ+ samples to show gating parameters used to isolate GFP+ PI- RPE cells (B) Volcano plots showing differentially expressed genes between MTZ+ rapamycin-treated and DMSO-treated groups at 2dpi and 4dpi. Dashed lines indicate the threshold criteria. Each dot represents an individual gene; red dots represent significantly upregulated DEGs, blue dots represent significantly downregulated DEGs, and black dots represent non-significant genes. (C) Pathway enrichment analysis on the significantly downregulated 2dpi and 4dpi DEGs. Numbers in parentheses are the gene counts enriched in each pathway. (D) Hierarchical clustering heatmap of the 15 genes enriched in the 2dpi immune system Reactome pathway across all four experimental groups showing these immune related genes are downregulated by rapamycin treatment. Heatmap legend represents log10 (counts per million mapped reads; CPM). |
(A) Schematic of the experimental paradigm showing the timeline for chemical treatments and ablation on transgenic larvae ( |
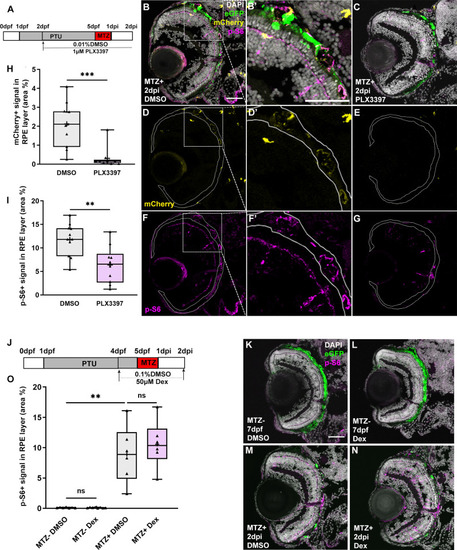
Fig 7. Macrophage/microglia function is required for the maintenance of mTOR activity in an inflammation-independent manner. (A,J) Schematic of the experimental paradigm showing the timeline for chemical treatments and ablation on transgenic larvae (mpeg1:mCherry;rpe65a:nfsB-eGFP). (B-G) MTZ+ DMSO- and PLX3397-treated larvae at 2dpi. Single channel immunofluorescent images of mCherry (D,E) and p-S6 (F,G) are shown. (B’,D’,F’) are high-magnification images showing the colocalization of p-S6 and mCherry. Nuclei (white), eGFP (green), p-S6 (magenta), mCherry (yellow). (H) Quantification of mCherry signal in the RPE layer showed a significant depletion of mCherry+ macrophages/microglia in the RPE after PLX3397 treatment in MTZ+ larvae, compared to DMSO-treated controls. (I) Quantification of p-S6 levels in the RPE layer showed a significant decrease in PLX3397-treated larvae, when compared to DMSO-treated controls. (K-N) Fluorescent images of p-S6 immunostaining on cryosections from MTZ- and MTZ+ DMSO- and Dex-treated larvae at 7dpf/2dpi. Nuclei (white), eGFP (green), p-S6 (magenta). (O) Quantification of p-S6 level in the RPE layer showed a significant increase in MTZ+ DMSO-treated larvae when compared to MTZ- DMSO-treated control, but no significant differences between Dex-treated and DMSO-treated larvae from MTZ- or MTZ+ groups. p-values: ** ≤ 0.01, *** ≤ 0.001. Statistical information can be found in S9 Table. Dorsal is up and distal is left. Scale bar = 50μm. |
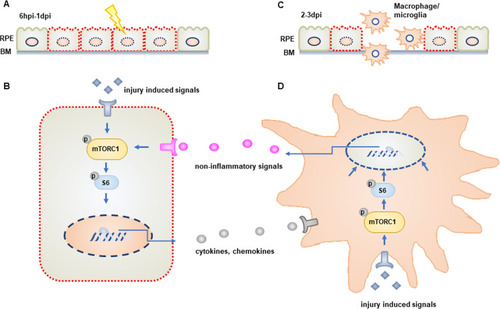
(A) mTOR activity is rapidly induced in damaged/regenerating RPE cells between 6hpi and 1dpi. (B) Activation of mTOR signaling in RPE cells regulates the expression of immune-related genes, including cytokines and chemokines. (C) mTOR activity is required for the recruitment of macrophages/microglia to the injured/regenerating RPE. (D) mTOR is also activated in macrophages/microglia recruited to the RPE post-injury and these cells are required to maintain mTOR activity in RPE cells during the later stages of the regenerative response. This maintenance occurs in an inflammation-independent manner. |