
- Title
-
Identification of Scd5 as a functional regulator of visceral fat deposition and distribution
- Authors
- Zhang, Q., Sun, S., Zhang, Y., Wang, X., Li, Q.
- Source
- Full text @ iScience

Zebrafish Scd is a better match of homolog to human SCD5 (A) Tissue expression profile of SCD5 in human from GTEx. (B) Tissue expression profile of Scd in zebrafish. (C) Amino acid similarity between hSCD5 and Scd homologs in several model animals. (D) Phylogenetic tree of SCDs based on amino acid sequences alignment. Zebrafish scd displayed highest homolog with human SCD5. The data are represented as mean ± SD EXPRESSION / LABELING:
|
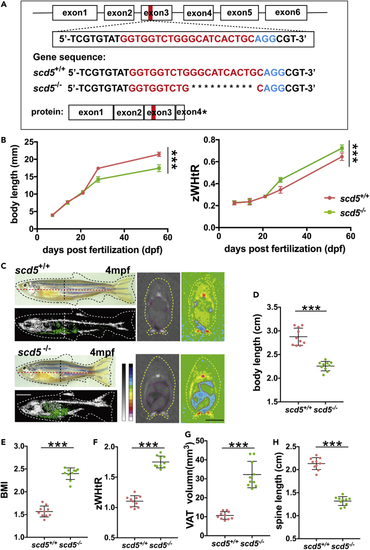
scd5-deficient zebrafish showed an apple-shaped body with visceral fat deposits and short spines (A) Diagram of target site on exon three of zebrafish scd5 genomic DNA, representative sequencing results of scd5+/+ and scd5−/− at six dpf larvae, red letter indicates N20 sequence, blue letter indicates NGG. (B) scd5−/− zebrafish exhibited differences in body length and body shape at around 30 dpf compared to scd5+/+ (n = 20). (C) Phenotype, the 3D reconstruction and section view of micro-CT scans on 4mpf scd5−/− zebrafish and their wild-type siblings. Black dotted lines indicate sectional position, red dotted line indicates body length, and yellow dotted curve indicates the outline of zebrafish. Blue area in section view indicates visceral adipose tissue. White scale bar = 5mm, Black scale bar = 2mm. D-H. 4mpf scd5−/− had significant decrease in body (D) and spine (H) length, significant increases in BMI (E), zWHtR (F) and VAT (G) (n = 10). The data are represented as mean ± SD ∗∗∗p < 0.001 represents statistical significance compared with wild-type controls (unpaired t test). PHENOTYPE:
|
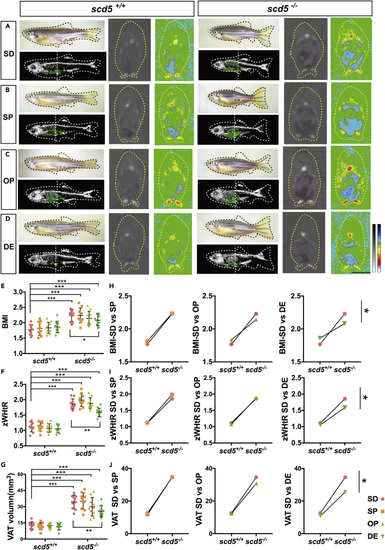
ω3-PUFA significantly rescued the ectopic adipose deposition of scd5 mutant (A–D) Appearance view, the 3D reconstruction, and section view of micro-CT scans on four different dietary supplementations fed scd5+/+ and scd5−/− zebrafish. White dotted vertical line indicates sectional position, blue area indicates adipose tissues. Scale bar = 2mm. (E–G) Data statistics on BMI, zWHtR, and VAT volumes of standard diet (SD), SD plus SFA (SP), SD plus MUFA (OP), and SD plus ω3-PUFA (DE) groups. Data are represented as mean ± SD two-way ANOVA results of every groups compared to scd5+/+ -SD were shown, and the simple effects within the same genotypes were also shown. H-J, two-way ANOVA results of three diets vs control for scd5+/+ and scd5−/−. ∗p < 0.05, ∗∗p < 0.01, ∗∗∗p < 0.001 represents statistical significance of interaction between genotype and dietary. n = 10 for each group. PHENOTYPE:
|

Transcriptome analysis of VAT of scd5−/− and scd5−/− DE (A) Histogram of number of DEGs obtained from the comparative analysis between the six samples. Pink square indicates upregulated, green square indicates downregulated (n = 2). (B) Venn analysis of DEGs. Each elliptical box represents different gene groups. Four genes sets were obtained by intersection. VAT-up-scd5−/− (2017 genes which were upregulated in VAT sample of scd5−/− compared to scd5+/+, restored in VAT sample of scd5−/− DE, and not significantly different in SAT samples of all three strains) , VAT-down-scd5−/− (7,776 genes which were downregulated in the VAT of scd5−/− compared to scd5+/+, restored in the VAT of scd5−/− DE, and have no significantly difference in the SAT of scd5−/− and scd5−/− DE), SAT-up-scd5−/− (862 genes which were upregulated in the SAT of scd5−/− compared to scd5+/+ and restored in the SAT of scd5−/− DE, and have no significantly difference in the VAT of all three strains), and SAT-down-scd5−/− (497 genes which were downregulated in the SAT of scd5−/− compared to scd5+/+, restored in the SAT of scd5−/− DE, and have no significantly difference in the VAT of scd5−/− and scd5−/− DE). |
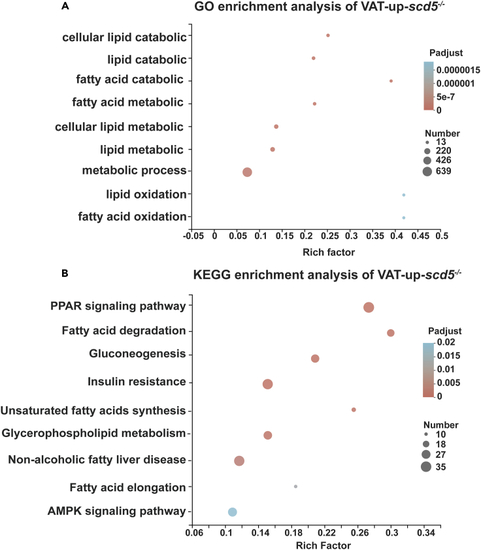
Significantly enriched pathways in VAT-up-scd5−/− gene sets (A) GO enrichment analysis showed genes enriched in lipid anabolism-associated pathways. (B) KEGG enrichment pathways include PPAR, C/EBP, fat synthesis, and fatty acid degradation/elongation pathways. |
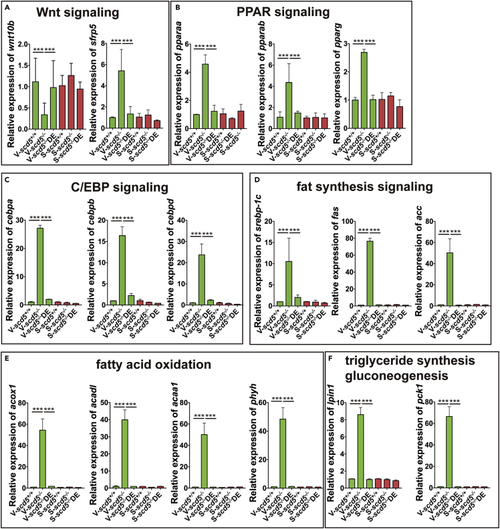
Relative expression of key nodes from main enriched pathways (A–F). Main enriched pathways include Wnt, PPAR, C/EBP, fat synthesis, fatty acid oxidation, triglyceride synthesis, and gluconeogenesis signaling pathways. n = 4. The data are represented as mean ± SD ∗∗∗p < 0.001 represents statistical significance compared with wild-type controls (one-way ANOVA). |