FIGURE SUMMARY
Title

Endothelial Semaphorin 3fb regulates Vegf pathway-mediated angiogenic sprouting

Authors
Watterston, C., Halabi, R., McFarlane, S., Childs, S.J.
Source
Full text @ PLoS Genet.

Endothelial expressed sema3fb promotes endothelial cell sprouting.

A) Lateral view of sema3fb expression at 30hpf by ISH. Inset shows expression in the dorsal aorta (DA) and intersegmental arteries (ISAs). B) Schematic representation of the zebrafish vasculature at 30 hpf. Inset: The ISAs sprout from the DA and connect to form the Dorsal Longitudinal Anastomotic Vessel (DLAV) by 30 hpf. C-E) Lateral confocal images of the trunk vasculature (black) of 30 hpf (C) wild type sibling (sib), (D) heterozygous (het) sema3fbca305/+ and (E) homozygous (hom) sema3fbca305 mutants. Gaps in the DLAV (blue asterisks) and truncated ISA sprouts (yellow arrowhead) are noted. Abbreviations: DA (Dorsal Aorta), and PCV (Posterior Cardinal Vein). Anterior, left; Dorsal, up. Scale bar, 100 μm. F) ISA Sprout length at 30 hpf in wild type (WT) sibs (mean length of 106±10 μm), het sema3fbca305/+ (92±19μm), and hom sema3fbca305 (91±18μm), ****p<0.0001. G) Percentage of ISA sprouts connecting to form DLAV at 30 hpf. WT sib (mean 83% connected), het sema3fbca305/+ (50% connected) and hom sema3fbca305 (42% connected), ****p<0.0001. H) Quantification of the cross-sectional diameter of ISA sprout at the level of the horizontal myoseptum (HM; dashed red line). WT sib (mean diameter of 6.9±2 μm), het sema3fbca305/+ (8.5±2.7 μm), and hom sema3fbca305 (9.2±2.9 μm)., **p<0.0016 and ***p = 0.0002. F-G) N = 3; WT sib = 11 embryos (n = 86 ISAs), het sema3fbca305/+ = 22 embryos (n = 163 ISAs), and hom sema3fbca305 = 9 embryos (n = 75 ISAs), 2-Way ANOVA Tukey’s multiple comparisons test. Error bars = ±SD.

Loss of <italic toggle='yes'>sema3fb</italic> disrupts ISA migration.

A) Lateral confocal time-lapse images from 25–29 hpf double transgenic Tg(kdrl:mCherry;fli1a:nEGFP) endothelial cells (magenta) and nuclei (white). The location of the horizontal myoseptum (green dashed line) and DLAV (blue dashed line) are noted to highlight ISA growth over time. Scale bar, 50 μm. B) Average ISA Sprout Length at 30-minute intervals from 25–29 hpf: WT vs sema3fbca305 at 25.0 hpf, p = 0.474; at 25.5 hpf p = 0.262; at 26.0 hpf p = 0.081; at 26.5 hpf *p = 0.023; at 27.0 hpf *p = 0.020; at 27.5 hpf **p = 0.030; at 28.0 hpf **p = 0.008; at 28.5 hpf **p = 0.007; at 29.0 hpf *p = 0.024. C-E) Quantification of ISA migration speeds (μm/min). C) At 26–27 hpf WT = 0.15 μm/min and sema3fbca305 = 0.12 μm/min, p = 0.157. D) At 27–28 hpf WT = 0.19 μm/min and sema3fbca305 = 0.13 μm/min, *p = 0.020. E) At 28–29 hpf: WT = 0.16 μm/min and sema3fbca305 = 0.19 μm/min, p = 0.461. B-E) N = 2; WT = 7 embryos (n = 33 ISAs) and sema3fbca305 = 7 embryos (n = 35 ISAs), Unpaired t-test with Welch’s correction. F-H) Lead angioblast distance from DA at 1hr intervals. F) At 27 hpf mean distance from DA: WT = 55.12±14.06 μm and sema3fbca305 = 47.18±5.75 μm, *p = 0.030. G) At 28 hpf mean distance from DA: WT = 71.57±15.47 μm and sema3fbca305 = 55.47±9.65 μm, ***p = 0.0008. H) At 29 hpf mean distance from DA: WT = 85.19±18.03 μm and sema3fbca305 = 68.36±16.64 μm, **p = 0.008. F-H) N = 1: WT = 4 embryos (20 ISAs) and sema3fbca305 = 3 embryos (15 ISAs), Unpaired t-test with Welch’s correction. I) Lateral confocal images of 30hpf double transgenic Tg(kdrl:mCherry;fli1a:nEGFP) endothelial cells (ECs, magenta) and nuclei (white). EC nuclei clumps (blue arrows/arrowheads) are noted. Scale bar, 100 μm. Inset: Schematics show method for measuring distance between EC nuclei and highlight EC nuclei clumps in ISAs. J) Number of EC nuclei (angioblasts) per ISAs at 30 hpf. WT (mean of 3 nuclei/ISA), heterozygous (het) sema3fbca305/+ (3 nuclei/ISA), and homozygous (hom) sema3fbca305 (3 nuclei/ISA). K) Quantification of inter-endothelial nuclei spacing per ISA at 30 hpf. WT (mean 28±13 μm), het sema3fbca305/+ (23±13μm), and hom sema3fbca305 (22±14 μm), ***p = 0.0002 and ****p<0.0001. L) Quantification of Average Area EC fli1a:nEGFP positive nuclei (angioblasts) per ISAs at 30 hpf. WT (mean 49±18 μm2), het sema3fbca305/+ (mean 60±24 μm2), and hom sema3fbca305 (mean 56±23 μm2),**p = 0.0069 and ****p<0.0001. I-L) N = 3; WT = 14 embryos (n = 138 ISAs), het sema3fbca305/+ = 19 embryos (n = 190 ISAs), and homsema3fbca305 = 11 embryos (n = 110 ISAs),. 2-Way ANOVA Tukey’s multiple comparisons test Error bars = ±SD.

A) Lateral images of the trunk vasculature with mosaic endothelial expression of the transgene fli1ep: Lifeact-EGFP highlighting actin (green) and endothelial cytoplasm using Tg(kdrl:mCherry; white) in ISAs at 30 hpf. DLAV gaps (blue asterisks) and truncated ISA sprouts (yellow arrowheads) are marked. Inset shows an enlarged view of single ISAs with Lifeact-EGFP expression that have reached the level of DLAV at 30hpf. Scale bar, 100 μm. B) Representative still images from time-lapse imaging from 28–30 hpf. Enlarged still images of stage-matched embryos with mosaic Lifeact-EGFP (green) in endothelial cells spanning the ISA and reaching the level of the DLAV by 28 hpf in both wild type and sema3fbca305 embryo. Endothelial cytoplasm is shown in red Tg(kdrl:mCherry). White arrowheads indicate filopodia present in connecting ISA sprouts within the boxed regions below the DLAV. C) Quantification of number Lifeact-EGFP positive filopodia on ISAs from 28–30 hpf from embryos of the indicated genotypes. N = 3: WT (14 EGFP positive ISAs/ 30 ISAs total, 6 embryos, mean of 4 filopodia/ISA) and homozygous sema3fbca305 (18 EGFP positive ISAs/35s ISAs total, 7 embryos, mean of 7 filopodia/ISA). Unpaired t-test with Welch’s correction,*p = 0.03 and ***p = 0.0002. Error bars = ±SD.

<italic toggle='yes'>sema3fb</italic> mutants have increased VEGF receptor expression and activity.

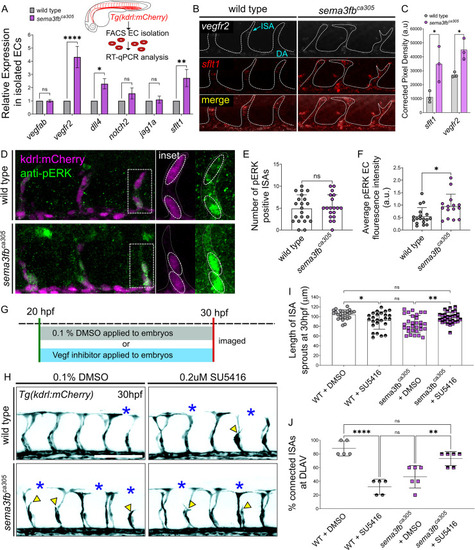
A) RT-qPCR analysis of key endothelial markers in wild type and sema3fbca305 FACS isolated Tg(kdrl:mCherry) positive endothelial cells at 26hpf (inset). N = 2, 2-Way ANOVA Tukey’s multiple comparisons test, *p = 0.0184, **p = 0.0021, and ****p<0.0001 (Refer to S3 Table for fold-change details). B) Fluorescent HCR in situ of 30 hpf whole-mount wild type and embryos sema3fbca305 embryos. Representative images show punctate overlapping expression of vegfr2 (white) and sflt1 (red) mRNA transcripts within the DA and ISAs (dashed white outline). C) Quantification of HCR in situ pixel density in ISAs and DA, wild type (WT, n = 3 embryos, 15 ISAs) and sema3fbca305 (n = 3 embryos, 15 ISAs), Unpaired Student’s t-test with Welch’s correction WT vs. sema3fbca305: vegfr2 *p = 0.047 and sflt1 *p = 0.036. D) Whole-mount Immunostaining for phosphoERK (pERK) in WT and sema3fbca305 embryos fixed at 30 hpf. Representative images show Tg(kdrl:mCherry) positive ISAs (purple) and pERK positive ECs (green). Inset: pERK positive ISAs are traced using kdrl:mCherry expression (dashed white line) and dashed oval outlines highlight individual ECs with pERK staining within each ISA. E) Number of pERK positive ISAs at 30hpf. F) Quantification of average pERK fluorescence intensity in embryos at 30 hpf. D-E) N = 3, WT (n = 21 embryos, mean of 5 pERK positive ISAs), and homzygous sema3fbca305 (n = 19 embryos, mean of 5 pERK positive ISAs). 2-Way ANOVA Tukey’s multiple comparisons test, *p = 0.012. G) Schematic of Vegfr2 inhibition time course, embryos are treated at 20 hpf with either 0.1%DMSO or Vegfr2 inhibitors and removed from treatment for live imaging at 30hpf. H) Representative confocal images of trunk vasculature (black) of 30 hpf embryos treated with DMSO control or 0.2 μM SU5416. DLAV gaps (blue asterisks) and truncated ISA (yellow arrowheads) are marked. Scale bar, 100 μm. I) Length of ISA sprouts in treated embryos at 30 hpf: WT + DMSO (n = 25 ISAs, mean of 104±9 μm), WT + 0.2 μM SU5416 (n = 25 ISAs, mean of 92±17 μm), sema3fbca305 + DMSO (n = 30 ISAs, mean of 85±17 μm), and sema3fbca305 + 0.2μm SU5416 (n = 30 ISAs, mean of 98±11 μm) **p = 0.0039 and ****p<0.0001. J) Percentage of ISA sprouts connected at DLAV in treated embryos at 30 hpf. WT + DMSO (n = 25 ISA-DLAV, 5 embryos, mean 88±11%), WT + 0.2μM SU5416 (n = 25 ISA-DLAV, mean 32±11%), sema3fbca305 + DMSO (n = 30 ISA-DLAV, mean 46±16%), and sema3fbca305 +0.2 μm SU5416 (n = 30 ISA-DLAV, mean 73±10%), **p = 0.0084, ***p = 0.0002, and ****p<0.0001. I-J N = 2; WT+DMSO = 5 embryos, WT + 0.2 μM SU5416 = 5 embryos, sema3fbca305 + DMSO = 6 embryos, sema3fbca305 + 0.2 μm SU5416 = 6 embryos,. 2-Way ANOVA Tukey’s multiple comparisons test. Error Bars = ±SD.

Model of <italic toggle='yes'>sema3fb</italic> action in sprouting vessels.

Sema3fb is expressed by endothelial cells during angiogenic sprout formation and acts through an autocrine mechanism to suppress Vegfr2 expression and maintain endothelial cell dynamics via controlling Dll4 expression and Notch signaling in addition to modulation of pERK. Loss of sema3fb increases Vegfr2, pERK, Dll4, and sFlt1 expression. This results in aberrant cellular morphology with wider sprouts, persistent filopodia, and larger nuclei. The changes in nuclear size and disrupted sprouting suggest a possible role for Sema3b to limit Vegf-mediated induction of downstream pERK signaling.

Acknowledgments
This image is the copyrighted work of the attributed author or publisher, and ZFIN has permission only to display this image to its users. Additional permissions should be obtained from the applicable author or publisher of the image. Full text @ PLoS Genet.