FIGURE SUMMARY
Title

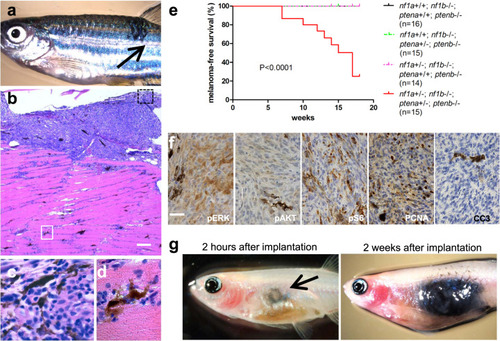
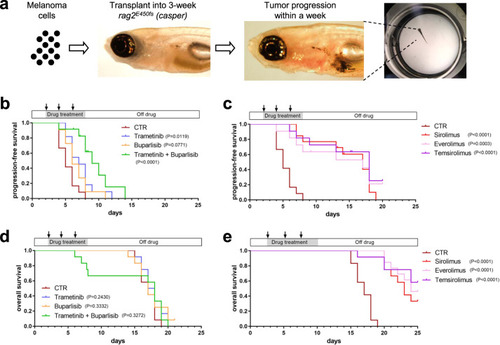
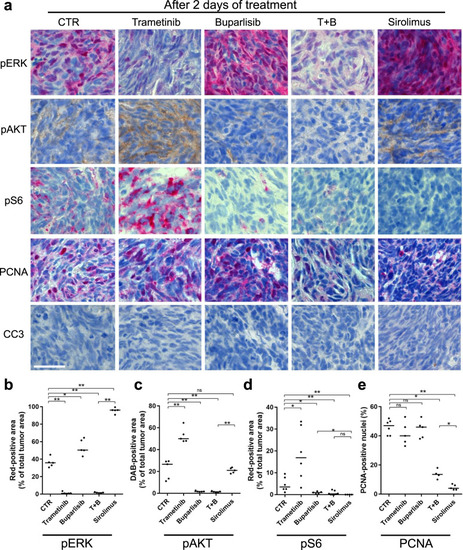
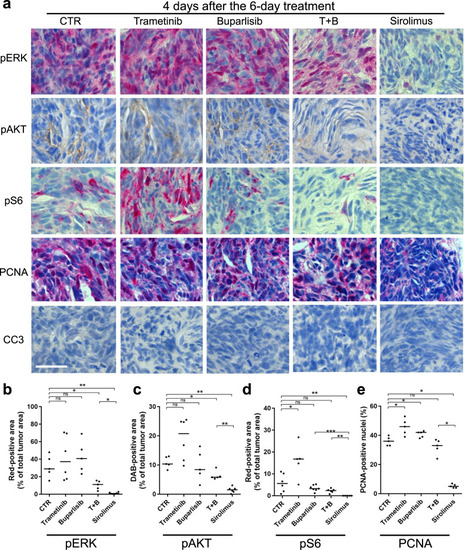
Synergistic melanoma cell death mediated by inhibition of both MCL1 and BCL2 in high-risk tumors driven by NF1/PTEN loss

Authors
He, S., Zimmerman, M.W., Layden, H.M., Berezovskaya, A., Etchin, J., Martel, M.W., Thurston, G., Jing, C.B., van Rooijen, E., Kaufman, C.K., Rodig, S.J., Zon, L.I., Patton, E.E., Mansour, M.R., Look, A.T.
Source
Full text @ Oncogene

<italic>nf1a</italic><sup><italic>+/−</italic></sup><italic>;nf1b</italic><sup><italic>−/−</italic></sup><italic>;ptena</italic><sup><italic>+/−</italic></sup><italic>;ptenb</italic><sup><italic>−/−</italic></sup><italic>;p53</italic><sup><italic>M214K/M214K</italic></sup> zebrafish spontaneously develop melanomas with rapid growth.

a Representative 16-week-old nf1a+/−;nf1b−/−;ptena+/−;ptenb−/−;p53M214K/M214K zebrafish with one spontaneous melanoma (indicated by arrow). b Hematoxylin and eosin (H&E) staining of the melanoma tumor shown in panel a (×5 magnification, scale bar = 200 μm). c Melanoma tumor cells from the black box in (b), magnified ×100. d Melanoma tumor cells that have invaded into the dorsal muscle from the white box in (b), magnified ×100. e Cumulative frequency of spontaneous melanomas arising in zebrafish with the indicated genotypes (generated by the inbreeding of the nf1a+/−;nf1b−/−;ptena+/−;ptenb−/−;p53M214K/M214K line, p < 0.0001, log-rank test). f Immunohistochemical analysis of melanoma tumor sections using antibodies to detect phosphorylated ERK1/2 (pERK), phosphorylated AKT (pAKT), phosphorylated S6 (pS6), proliferating cell nuclear antigen (PCNA) and cleaved caspase 3 (CC3) (×63 magnification, scale bar = 20 μm). The percentage of PCNA+ cells was determined by manually counting positive and negative melanoma cells in one representative high-power field (150–200 cells per field) within three independent tumor samples. g Pigmented nf1/pten-mutant melanoma cells were transplanted intraperitoneally into adult rag2−/− Casper zebrafish. The implanted melanoma cells (left panel, arrow) grew rapidly into secondary tumors (within 2 weeks; right panel).

mTOR inhibitors achieve a durable antitumor effect in <italic>nf1/pten</italic>-mutant melanoma.

a Schematic of the melanoma tumor transplantation assay. b, c Transplanted nf1/pten-mutant melanoma tumor cells were monitored daily in 3-week-old rag2−/− recipient zebrafish treated with DMSO (CTR; n = 12), 80 nM trametinib (n = 11), 2 μM buparlisib (n = 11), or the combination of 80 nM trametinib and 2 μM buparlisib (n = 12) for 6 days. Kaplan–Meier curves for progression-free survival (PFS, b) and overall survival (OS, c) are shown. Statistical analyses were performed by log-rank test, comparing drug-treated with DMSO-treated zebrafish. d, e Transplanted nf1/pten-mutant melanoma tumor cells were monitored daily in 3-week-old rag2−/− recipient zebrafish treated with DMSO (CTR; n = 12, same values as in b, c), 20 μM sirolimus (n = 12), 20 μM everolimus (n = 11) or 40 μM temsirolimus (n = 11) for 6 days. Kaplan–Meier curves are shown, with statistical analyses performed as in b, c. For all experiments involving drug treatments, drugs were replenished every 2 days during the 6-day course of treatment (black arrows).

Sirolimus, but not trametinib or buparlisib, prevents rapid relapse of <italic>nf1/pten</italic>-mutant melanoma following treatment.

Three-week-old rag2−/− zebrafish transplanted with pigmented nf1/pten-mutant melanoma cells were treated for 6 days with DMSO, 80 nM trametinib, 2 μM buparlisib, the combination of 80 nM trametinib and 2 μM buparlisib, or 20 μM sirolimus. a, c, e, g, and i Representative zebrafish at the end of the 6-day drug treatment. b, d, f, h, and j Representative zebrafish at 4 days following the end of drug treatment. k Quantification of melanotic nf1/pten-mutant tumor-cell area at the end of the 6-day course of drug treatment (left), and 4 days later (right). ns p > 0.05, *p < 0.05, **p < 0.01, ***p < 0.001 by two-tailed, unpaired t-test. Scale bar = 1 mm.

Sirolimus strongly inhibits proliferation in <italic>nf1/pten</italic>-mutant melanomas.

a Representative tissue sections from a transplanted nf1/pten-mutant melanoma tumor after 2 days of treatment with DMSO (CTR), 80 nM trametinib, 2 μM buparlisib, the combination of 80 nM trametinib and 2 μM buparlisib, or 20 μM sirolimus. Sections were immunostained using antibodies to detect pERK, pAKT, pS6, PCNA, and cleaved caspase-3 (CC3). pERK-, pAKT- and pS6-positive tumor areas, as well as PCNA-positive nuclei, are quantified post-treatment in (be). “T + B” refers to trametinib plus buparlisib. ns p > 0.05, *p < 0.05, **p < 0.01 by Mann–Whitney test. Scale bar = 20 μm.

Sirolimus induces a durable cytostatic effect in <italic>nf1/pten</italic>-mutant melanomas.

a Representative tissue sections from a transplanted nf1/pten-mutant melanoma tumor at 4 days after a 6-day drug treatment with DMSO (CTR), 80 nM trametinib, 2 μM buparlisib, the combination of 80 nM trametinib and 2 μM buparlisib, or 20 μM sirolimus. Sections were immunostained using antibodies to detect pERK, pAKT, pS6, PCNA, and CC3. pERK-, pAKT- and pS6-positive tumor areas, as well as PCNA-positive nuclei, are quantified in (be). “T + B” refers to trametinib plus buparlisib. ns p > 0.05, *p < 0.05, **p < 0.01, ***p < 0.0001 by Mann–Whitney test. Scale bar = 20 μm.

Sirolimus synergizes with venetoclax and S63845 to suppress <italic>nf1/pten</italic>-mutant melanoma tumor growth and extend the survival of tumor-bearing zebrafish.

a Representative sagittal tissue sections from a transplanted nf1/pten-mutant melanoma tumor treated for 2 days with the indicated drugs. Sections were immunostained with antibodies to detect LC3A/B. Left panels: E = eye, B = brain, G = gut, K = kidney, L = liver, S = swim bladder, T = tumor. Right panels: ×63 magnification of tumor cells from the small black boxes in left panels. bg Transplanted nf1/pten-mutant melanoma tumor cells were monitored daily in 3-week-old rag2−/− recipient zebrafish treated with DMSO (CTR), venetoclax, S63845, sirolimus, or the drug combinations (n = 11 or 12 for each curve; doses as indicated). Kaplan–Meier curves for PFS (b, d, and f) and OS (c, e, and g) were compared using a log-rank test. Drugs were refreshed every 2 days during the 6-day course of treatment, as indicated by black arrows. h Representative tissue sections from transplanted nf1/pten-mutant melanoma tumors treated for 2 days with DMSO (CTR), 7.5 μM venetoclax and 2.5 μM S63845, 10 μM sirolimus, and the three-drug combination. Sections were immunostained using antibodies to detect PCNA and CC3 and quantified in (i). ns p > 0.05, ***p < 0.0001 by Mann–Whitney test. Scale bars = 20 μm.

Venetoclax and S63845 synergize with sirolimus to induce apoptosis in human <italic>NF1/PTEN</italic>-deficient melanoma cells.

a Western blots for NF1 and PTEN in a panel of human melanoma cell lines. HEK293 and Jurkart cells were included as positive and negative controls. The levels of total ERK1/2 expression serve as the loading control. b Relative cell viability of WM-3246 cells (Cell Titer Glo assay) upon treatment with sirolimus, venetoclax, or S63845 for 6 days. Mean ± s.d. values. c Relative cell viability of WM-3246 cells (Cell Titer Glo assay) upon treatment with the combination of sirolimus, venetoclax, and S63845 for 6 days. Mean ± s.d. values. d WM-3246 cell growth kinetics after treatment with the combination of sirolimus, venetoclax, and S63845 (for doses see panel c). Mean ± s.d. values. e Synergistic effects of venetoclax and S63845 on suppression of sirolimus-sensitized WM-3246 cells were analyzed by isobologram analysis. f Western blots for BCL2, BCLXL, and MCL1 in WM-3246 cells treated with venetoclax or S63845 for 24 h. g Western blots for cleaved caspase-3 in WM-3246 cells treated with the combination of sirolimus, venetoclax, and S63845.

Acknowledgments
This image is the copyrighted work of the attributed author or publisher, and ZFIN has permission only to display this image to its users. Additional permissions should be obtained from the applicable author or publisher of the image. Full text @ Oncogene