FIGURE SUMMARY
Title

Unbiased Label-Free Quantitative Proteomics of Cells Expressing Amyotrophic Lateral Sclerosis (ALS) Mutations in CCNF Reveals Activation of the Apoptosis Pathway: A Workflow to Screen Pathogenic Gene Mutations

Authors
Cheng, F., De Luca, A., Hogan, A.L., Rayner, S.L., Davidson, J.M., Watchon, M., Stevens, C.H., Muñoz, S.S., Ooi, L., Yerbury, J.J., Don, E.K., Fifita, J.A., Villalva, M.D., Suddull, H., Chapman, T.R., Hedl, T.J., Walker, A.K., Yang, S., Morsch, M., Shi, B., Blair, I.P., Laird, A.S., Chung, R.S., Lee, A.
Source
Full text @ Front. Mol. Neurosci.

Proteogenomic workflow to determine whether potential ALS gene candidates cause disease. Discovery of gene mutations by whole-genome, whole-exome, or targeted sequencing. cDNA gene constructs candidate mutations are inserted into cell models (e.g., HEK293 or Neuro2A cells). Ex vivo models such as patient fibroblasts (if available) that contain the gene mutation can also be used or converted into iPSCs for further differentiation. Label-free quantitative proteomics is used to analyze and provide a profile of protein expression changes that cluster to biological processes and signalling pathways. These biological pathways can then be validated using standard biochemical methods and/or in animal models. Animal models, such as zebrafish, have the advantage of generating progeny relatively quickly and can be extended to study motor phenotypes.

Label-free quantitative proteomics of HEK293 cells transfected with different cyclin F mutations (wild type, K97R, S195R, S509P, R574Q, S621G). (A) Hierarchical group clustering of proteome profiles from transfected cells showed ALS-specific and non-ALS mutations grouped together. Immunoblot analysis (B) and LFQ proteomics (C) of relatively equal cyclin F expression levels in transiently transfected HEK293 cells. (D) Two-dimensional principle component analysis (PCA) reflects the data quality and similarities of the proteome profiles between each biological replicate that are grouped by cyclin F mutations. Figures (A,C,D) were generated using Proteome Discoverer 2.3 (Thermo).

(A) Gene ontology (GO) distribution of the global proteome of HEK293 cells expressing cyclin F variants under the “Protein Class” category demonstrating proteins are classified as having molecular functions: nucleic acid binding, hydrolase, and transferase activity. (B) Selected gene ontology (GO) annotations of unique proteins clustered to selected pathways in neuroinflammation and ALS signalling. (C) Ingenuity pathway analysis (IPA) of the proteomic profile of cyclin F variants predicts activation and inhibition of various canonical cellular pathways. Apoptosis signaling was predicted to be activated in cells expressing cyclin F K97R, S195R, and S621G. Orange and blue annotation refer, respectively, to predicted activation and inhibition as determined by IPA. (D) Heatmap of label-free proteomics of differentially expressed proteins in the apoptosis signaling pathway and IPA prediction of downstream effects (log2 values shown; values shown as 5 and −5, respectively, indicate detection of the presence and absence of a protein and are not measured values). Red and green annotations refer, respectively, to experimentally measured values. Orange and blue annotations and lines refer, respectively, to predicted activation and inhibition as determined by IPA. Filled and dashed lines, respectively, refer to direct and indirect causal relationships.

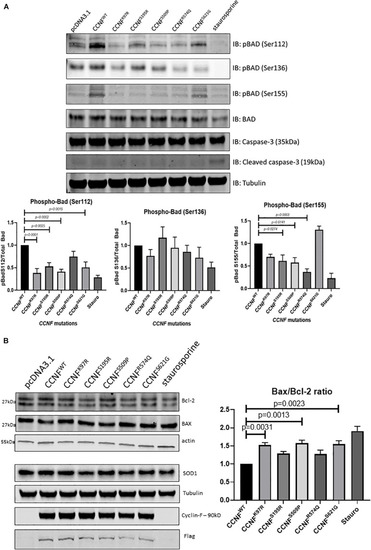
(A) Phosphorylation of Bcl-2 associated agonist of cell death (Bad) at Ser112, Ser136, and Ser155 reveals activation of the intrinsic apoptosis pathway. pBad (Ser112) was decreased in the cyclin F variants K97R (0.385-fold, p = 0.0001, n = 4), S195R (0.529-fold), S509P (0.413-fold), and S621G (0.508-fold) when compared to the cyclin F wild-type control (one-way ANOVA with Dunnett’s multiple comparison test, n = 4). pBad (Ser155) was decreased in only S195R (0.616-fold), S509 (0.578-fold), and R574Q (0.37-fold) when compared to the cyclin F wild-type control (one-way ANOVA with Dunnett’s multiple comparison test, n = 4). (B) Immunoblot analysis of Bcl-2, Bax, and SOD1 from cells expressing cyclin F wild-type and variants (K97R, S195R, S509P, R574Q, S621G) reveals increased Bax/Bcl-2 ratios in K97R (1.53-fold), S509P (1.58-fold), and S621G (1.55-fold) (one-way ANOVA with Dunnet’s multiple comparison test, n = 3) suggesting increased stimulation of apoptosis.

(A) iPSCs from asymptomatic and symptomatic ALS patients harboring the CCNF S621G mutation were subjected to global proteomics analysis. IPA of the quantitative proteomics data predicted activation of the apoptosis pathway. Red and green annotations refer, respectively, to experimentally measured values. Orange and blue annotations and lines refer, respectively, to predicted activation and inhibition as determined by IPA. Dashed lines indicate an indirect causal relationship (log2 values shown; values shown as 5 and −5, respectively, indicate detection of the presence and absence of a protein and are not measured values). (B) Immunoblot analysis of iPSCs from asymptomatic and symptomatic ALS patients harboring the CCNF S621G mutation compared to healthy controls reveals increased expression of pro-apoptotic proteins Bid and Bax. One-way ANOVA with Dunnett’s multiple comparison test (n = 3).

(A) Lys48-ubiquitylation E3 ligase activity assay of immunoprecipitated cyclin F from cells expressing cyclin F wild-type, K97R, S195R, S509P, R574Q, and S621G. (B) Cyclin F interacts with caspase 3. HEK293 cells transfected with mCherry-cyclin F and immunoprecipitated (left blot) shows interaction with endogenous caspase-3. The reverse immunoprecipitation to enrich caspase-3 showed the same interaction with cyclin F (right blot).

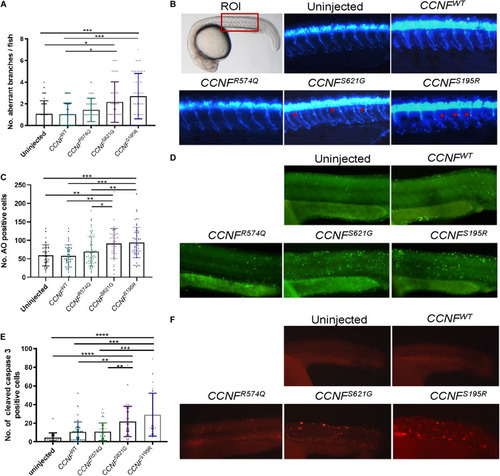
Measurements of aberrant neuron branching and apoptosis activation in zebrafish injected with CCNF gene variants S621G, S195R, R574Q, and wild type. (A) Blinded analysis of the number of aberrant branches in zebrafish expressing cyclin F S621G and S195R, respectively, had 2.01-fold (p-value = 0.006, n = 42) and 2.4-fold (p-value = 0.0011, n = 46) more aberrantly branched motor neurons compared to the wild type (one-way ANOVA). Region of interest (ROI) in zebrafish used for imaging. (B) Representative images of zebrafish expressing blue fluorescent protein in motor neurons used to analyse primary motor axon branching. Examples of aberrant branching indicated by red arrows. (C) Cyclin F S621G and S195R had displayed increased cleaved caspase-3 activity by 2.08-fold (n = 39, p-value = 0.0029 and 2.79-fold (n = 28, p-value = 0.0004) (one-way ANOVA adjusted with Kruskal–Wallis test). (D) Representative images of live zebrafish staining with AO. (E) AO positive cells in S621G and S195R were 1.4-fold (p-value = 0.0496, n = 37) and 1.45-fold (p-value = 0.0115, n = 57) higher, respectively, compared to the wild type (one-way ANOVA). (F) Representative images of zebrafish immunostained with cleaved caspase-3 primary antibody. *p ≤ 0.05, **p ≤ 0.01, ***p ≤ 0.001, ****p ≤ 0.0001.

Acknowledgments
This image is the copyrighted work of the attributed author or publisher, and ZFIN has permission only to display this image to its users. Additional permissions should be obtained from the applicable author or publisher of the image. Full text @ Front. Mol. Neurosci.