FIGURE SUMMARY
Title

ZebraShare: a new venue for rapid dissemination of zebrafish mutant data

Authors
DeLaurier, A., Howe, D.G., Ruzicka, L., Carte, A.N., Mishoe Hernandez, L., Wiggins, K.J., Gallati, M.M., Vanpelt, K., Loyo Rosado, F., Pugh, K.G., Shabdue, C.J., Jihad, K., Thyme, S.B., Talbot, J.C.
Source
Full text @ Peer J.

Publicizing a mutant on ZebraShare in 5 steps.

Example of how to determine DNA coordinates for a simple deletion allele, <italic>phf21aa</italic><sup xmlns:xlink='http://www.w3.org/1999/xlink'><italic>aik</italic>4</sup>.

(A) Align the WT and mutant sequence. (B) Blast the aligned WT sequence and determine the base numbers altered in the mutant. (C) Transfer these coordinates to the ZebraShare submission workbook. Descriptions become more complex for combined insertion/deletions alleles (InDels) and for alleles with multiple mutation sites due to use of multiple guide RNAs.

Example of a mutant, <italic>phf21aa</italic><sup><italic>aik</italic>4</sup>, publicized via ZebraShare.

(A) The allele description page shows information that helps researchers interpret the mutant. (B) The abstract page gives an overview of phenotypic characterization. (C) The figure associated with the abstract shows pertinent phenotypic details. For phf21aaaik4, the mutants appeared normal, save for a mild rotation of the ceratohyal cartilage (red arrow). Fish larvae are stained with alcian blue (cartilage) and alizarin red (bone) to reveal skeletal shape. The three scalebars in C each = 200 microns.

Skeletal structure is normal in <italic>kdm1a</italic> maternal zygotic mutants.

Wild-type larvae (A–C) compared with kdm1a maternal zygotic mutant larvae (D–F). (A and D) Whole mount specimens, lateral view of head skeleton, (B and E) flat mount pharyngeal skeleton, pharyngeal arches 1 and 2, lateral view, (C and F) flat mount neurocranium, ventral view. Fish larvae are stained as described in Fig. 3. Scale bar = 200 microns.

Embryonic disintegration in <italic>ctnnd1</italic> mutants.

(A, B) Frames from time-lapse imaging (Movie S1) illustrate disintegrating phenotype of ctnnd1 mutants. Asterisk(s) mark two of the embryos that disintegrated during the time-lapse recording. (C) DAPI staining of fixed ctnnd1 mutant embryos reveals that cells with intact nuclei dissociate from the embryo. (D–F) Phenotypes of ctnnd1 sibling embryos at the 6-somite stage. The homozygous mutant (F) has disintegrated, the heterozygous mutant (E) displays clumps of cells along the dorsal surface, and the wild-type embryo appears normal (D). The solid arrow marks a clump of cells dorsal to the midbrain and the open arrowhead marks a clump of cells dorsal to the hindbrain in the heterozygote.

(A) Normal sibling and (B) snu13a;snu13b double mutant at 24 hpf. Tail region is outlined in orange, head in blue. The shown double mutant was confirmed to be homozygous by Sanger sequencing. Scale bar is 1 mm.

A decision tree on whether to publicize findings in ZebraShare.

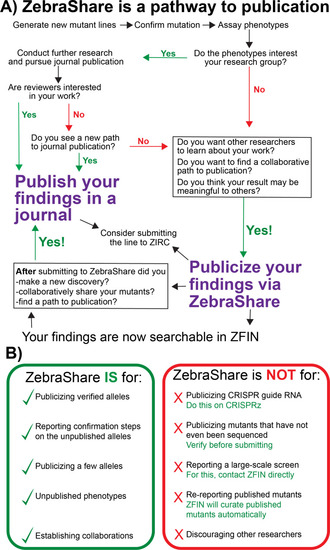
(A) A ZebraShare submission immediately disseminates your information to the scientific community and also can serve as a pathway to journal publication. (B) Comparison of correct and misplaced ZebraShare submissions, with solutions for incorrect uses.

Acknowledgments
This image is the copyrighted work of the attributed author or publisher, and ZFIN has permission only to display this image to its users. Additional permissions should be obtained from the applicable author or publisher of the image. Full text @ Peer J.