FIGURE SUMMARY
Title

HIF1α-dependent induction of the mitochondrial chaperone TRAP1 regulates bioenergetic adaptations to hypoxia

Authors
Laquatra, C., Sanchez-Martin, C., Dinarello, A., Cannino, G., Minervini, G., Moroni, E., Schiavone, M., Tosatto, S., Argenton, F., Colombo, G., Bernardi, P., Masgras, I., Rasola, A.
Source
Full text @ Cell Death Dis.

Characterization of Zebrafish TRAP1 Knock-out fish.

a Western blot analysis of TRAP1 protein level in wild-type and knock-out animals at 96 hpf. The mitochondrial protein citrate synthase was used as a loading control. b Quantification of Zebrafish embryos birefringence from 48 hpf to 120 hpf; data are presented as percentage of muscle birefringence normalized for the fish area for at least 10 animals per condition for three independent experiments. cd Behavioral assay showing the total distance moved by fish embryos for at least 12 animals per condition. e Average distance (in mm) for each 2-min interval swum by larvae under light-dark period (dark period in gray) at 5 dpf. f Cardiac frequency measured in at least 10 animals per condition expressed as beats per minute (BPM) that were calculated by averaging the beats counted four times in 15 s. g In situ analysis of liver prox1 and pancreas trypsin markers in zebrafish embryos at 72 hpf, data are reported as average ±SEM. with an unpaired two-tailed Student’s t test of four animals per condition. h Representative images of developing embryos at 6 hpf and measurements of epiboly area; the yolk was not considered in the analysis. i Kinetics of fish growth during the first 7 days of development. The total fish area, excluding the yolk region, was evaluated. j Analysis of TRAP1 protein expression profile during the first four days of embryogenesis. Asterisks indicate significant differences (*p < 0.05, **p < 0.01, ***p < 0.001).

TRAP1 knock-out in Zebrafish affects early embryogenesis stages and mitochondrial bioenergetics.

a Measurement of oxygen consumption rate (OCR) in TRAP1 wild-type and knock-out embryos at 96 hpf. Respiratory complex I and III inhibitors (2 μM rotenone and 5 μM antimycin A, respectively) were added where indicated. Left: representative traces; right: quantification of basal respiration. bd Succinate-CoQ reductase (SQR) enzymatic activity of succinate dehydrogenase (SDH) in total wild-type or TRAP1 knock-out embryo lysates. Where indicated, embryos were treated with the TRAP1 inhibitor compound 5 (100 µM) for 2 h. e Kinetics of fish growth from 48 hpf to 96 hpf; where indicated, fish were treated with succinate (500 µM or 1 mM). Succinate was added directly in fish water every day from 24 hpf to 96 hpf. The total fish area, excluding the yolk region, was considered. f Quantification of basal mitochondrial respiration in wild-type and TRAP1 knock-out embryos at 96 hpf; where indicated, fish were treated with succinate 1 mM every day from 24 hpf until 96 hpf. Inhibitors of respiratory complex I and III (2 μM rotenone and 5 μM antimycin A, respectively) were added where indicated. Data were normalized to untreated fish and reported as average ±SEM of at least six animals (a, f) or 15 animals (e) and 60 embryos (in b–d) per condition. In a, c, d, e, f data are reported as average ±SEM with an unpaired two-tailed Student’s t test; in (b) data are reported as average ±SEM with one-way ANOVA and Bonferroni’s correction of at least four independent experiments; asterisks indicate significant differences (*p < 0.05, ∗∗p < 0.01, ***p < 0.001).

TRAP1 is induced following hypoxia.

a Western blot analysis (left) and protein quantification (right) of TRAP1 expression level in embryos exposed to hypoxia (5% O2) from the stage of 48 hpf for 24 and 48 h. b TRAP1 expression profile was analyzed at 96 hpf following short-term hypoxia treatment as indicated. c Western blot analysis of TRAP1 expression in Zebrafish at 5 dpf following short-term hypoxia treatment. d Western blot analysis and quantification of TRAP1 expression in MIA PaCa-2 human pancreatic adenocarcinoma cells following 2–6 h of hypoxia (0.5% O2) or treatment with CoCl2 (0.5 mM for 6 h). The mitochondrial protein citrate synthase and actin were used as loading controls for fish and human cells, respectively. Data are reported as average ±SEM of at least three independent experiments with an unpaired two-tailed Student’s t test; asterisks indicate significant differences (*p < 0.05, **p < 0.01, ***p < 0.001).

EXPRESSION / LABELING:
Gene:
Fish:
Condition:
Anatomical Term:
Stage Range: Protruding-mouth to Day 5
PHENOTYPE:
Fish:
Condition:
Observed In:
Stage Range: Protruding-mouth to Day 5

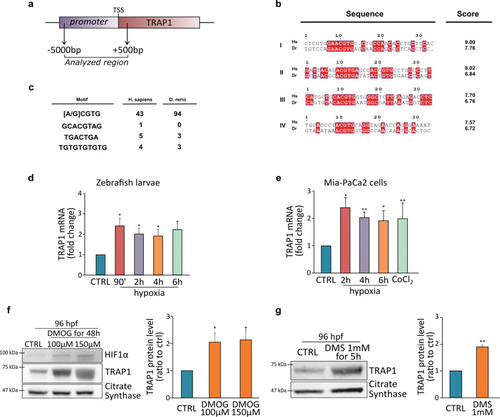
a Schematic representation of the TRAP1 promoter region analyzed that encompasses position −5000 bp to +500 bp from the transcription initiation site. b List of the four (I–IV) HRE regions more conserved between human (Homo sapiens, Hs) and Zebrafish (Danio rerio, Dr) TRAP1 promoters. Scoring was calculated using the position-specific matrix. c Alternative hypoxia-dependent regulative motifs found within the TRAP1 promoter region of Homo sapiens and Danio rerio. d, e Analysis of TRAP1 mRNA expression in wild-type Zebrafish embryos (d) and MIA PaCa-2 human pancreatic adenocarcinoma cells (e) exposed to hypoxia for the indicated times. Values were normalized for expression of rpl13 (d) and actin (e) used as housekeeping genes. f Western blot analysis and protein quantification of TRAP1 expression in embryos at 96 hpf following a 48 h treatment with 100 and 150 µM dimethyloxalyglycine (DMOG). g Western blot analysis and protein quantification of TRAP1 expression in embryos at 96 hpf following a 5 h treatment with 1 mM dimethylsuccinate (DMS). Data are reported as average ±SEM of at least three independent experiments with an unpaired two-tailed Student’s t test; asterisks indicate significant differences (*p < 0.05, **p < 0.01, ***p < 0.001).

TRAP1 is overexpressed in pancreatic tumors and downregulates SDH activity.

a Western blot analysis and protein quantification of TRAP1 in wild-type pancreas and in pancreatic tumors driven by KRASG12D expression (1 year post-fertilization, ypf). Values were normalized for citrate synthase. b Analysis of TRAP1 mRNA expression in wild-type pancreas and in pancreatic tumors at 1 ypf. Values were normalized for expression of rpl13 and actin, used as housekeeping genes. The number of animals used in each condition is reported inside column bars. c Colorimetric assay (pink staining) of SDH activity in tissue slides of wild-type pancreas and pancreatic tumors with/without the TRAP1 specific inhibitor compound 5 (100 μM, 30 min pre-incubation). In (a, b), data are reported as average ±SEM of at least four different animals per condition with an unpaired two-tailed Student’s t test; asterisks indicate significant differences (*p < 0.05).

EXPRESSION / LABELING:
Gene:
Fish:
Anatomical Term:
Stage: Adult
PHENOTYPE:
Fish:
Observed In:
Stage: Adult

TRAP1 inhibits respiration under hypoxia.

a Spectrophotometric measurements of SDH activity on wild-type Zebrafish embryos kept in normoxia or hypoxia (5% O2) for 48 h. Where indicated, embryos were treated with the specific TRAP1 inhibitor compound 5 (100 μM, 2 h). b Assessment of oxygen consumption rate (OCR) in wild-type embryos at 96 hpf, either untreated (blue line and bar) or exposed to hypoxia for 48 h (orange line and bar). Respiratory complex I and III inhibitors (2 μM rotenone and 5 μM antimycin A, respectively) were added where indicated. c, d OCR measurements in TRAP1 wild-type and knock-out living Zebrafish embryos, either kept in normoxic condition or after 2 h of exposure to hypoxia (5% O2). Subsequent additions of the proton uncoupler carbonyl cyanide-4-(trifluoromethoxy)phenylhydrazone (FCCP, 0.5 μM) and of the respiratory complex I and III inhibitors (2 μM rotenone and 5 μM antimycin A, respectively) were carried out as indicated. The specific TRAP1 inhibitor compound 5 (100 μM) was added in fish water 4 h prior to OCR analysis. In fish exposed to hypoxia, the drug was added 2 h before hypoxic treatment and maintained throughout hypoxia exposure. The number of animals used for each condition is reported inside column bars. e Schematic representation of the feed-forward crosstalk between HIF1α and TRAP1. In (a–d), data are reported as average ±SEM with one-way ANOVA and Bonferroni’s correction of four independent experiments (a, c, d), or at least 20 animals per condition (b) with an unpaired two-tailed Student’s t test. Asterisks indicate significant differences (*p < 0.05, ∗∗p < 0.01, ***p < 0.001).

Acknowledgments
This image is the copyrighted work of the attributed author or publisher, and ZFIN has permission only to display this image to its users. Additional permissions should be obtained from the applicable author or publisher of the image. Full text @ Cell Death Dis.