
- Title
-
Mycobacterial infection-induced miR-206 inhibits protective neutrophil recruitment via the CXCL12/CXCR4 signalling axis
- Authors
- Wright, K., de Silva, K., Plain, K.M., Purdie, A.C., Blair, T.A., Duggin, I.G., Britton, W.J., Oehlers, S.H.
- Source
- Full text @ PLoS Pathog.
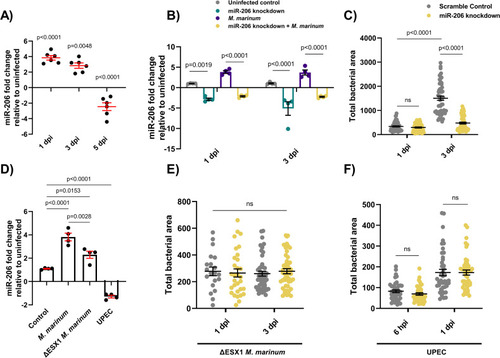
(A) Expression of miR-206 analysed by qPCR at 1, 3, and 5 dpi. (B) Expression of miR-206 in uninfected and infected antagomir-injected embryos (miR-206 knockdown). (C) |
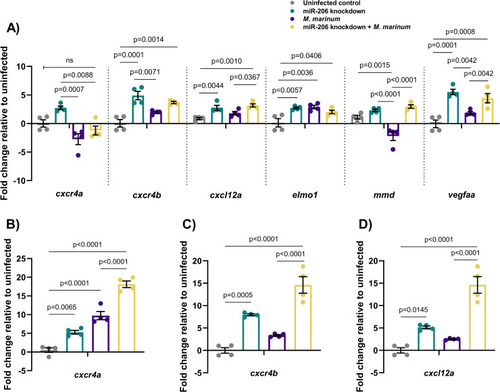
(A) Expression of candidate target genes measured by qPCR at 1 dpi in miR-206 knockdown embryos. (B-D) Expression of zebrafish CXCL12/CXCR4 pathway ortholog genes at 3 dpi. Each data point represents a single measurement of 10 pooled embryos and 2 biological replicates, with the mean and SEM shown. |

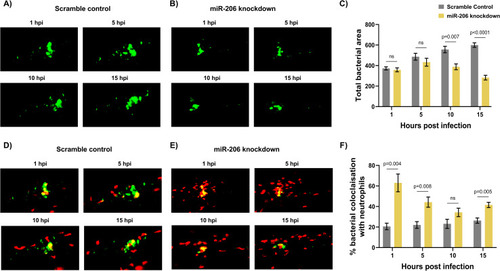
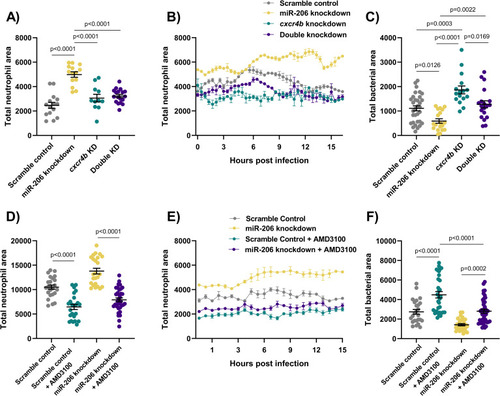
(A) Representative images of infection phenotype at 3 dpi in control and miR-206 knockdown embryos. White arrows indicate bacterial foci. Neutrophils are red (lyzC:dsred) and M. marinum is green (wasabi); co-localisation is indicated by yellow fluorescence. (B) Measurement of whole-body neutrophil fluorescent area at 1 and 3 dpi in miR-206 knockdown embryos. (C) Measurement of neutrophil levels following trunk infection with M. marinum in miR-206 knockdown embryos. (D) Measurement of neutrophil retention at sites of infection following trunk infection with M. marinum in control and miR-206 knockdown embryos. (E) Measurement of neutrophil recruitment to a sterile tail fin wound in miR-206 knockdown embryos. Each data point represents a single measurement, with the mean and SEM shown. For time-lapse imaging, each data point represents the mean of 6 foci of infection from 6 separate embryos. Neutrophil retention was measured by selecting 10 random cells in 3 embryos per group and measuring the time spent at the granuloma. Bacterial burden analysis was performed on 15–20 embryos per treatment. Graphs are representative of 2 biological replicates. * P < 0.05, ** p < 0.01, *** p < 0.001. |
(A-B) Representative images of bacterial granulomas in trunk-infected control and miR-206 knockdown embryos. (C) Quantification of |
(A) Whole body neutrophil counts at 3 dpi of |
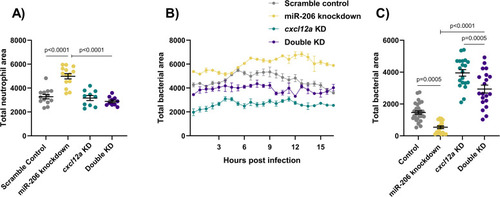
(A) Whole body neutrophil counts at 3 dpi of |