
- Title
-
Automated Analysis of Cerebrospinal Fluid Flow and Motile Cilia Properties in The Central Canal of Zebrafish Embryos
- Authors
- Thouvenin, O., Cantaut-Belarif, Y., Keiser, L., Gallaire, F., Wyart, C.
- Source
- Full text @ Bio Protoc

Brain ventricle injection site and injection quality assessment. Left panel: Injection site of fluorescent beads in the hindbrain ventricle of a 30 h post fertilization (hpf) embryo. An hour after injections in the hindbrain ventricle, 20 nm beads have propagated along the central canal. Right panel: TexasRed (top) and 20 nm beads (bottom) imaging with spinning disk in the central canal of the spinal cord above the yolk extension. Scale bar: 10 µm. |
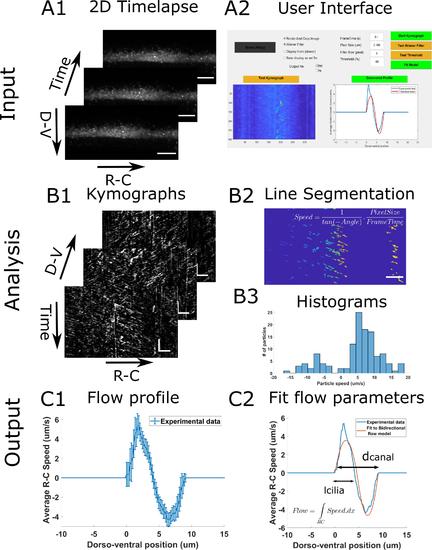
Principle of the CSF flow profile analysis workflow. The CSF flow profiles are calculated using 2D time lapses of fluorescent beads flowing in the central canal (A1), and our custom user interface software (A2). The Start Kymograph button starts the analysis by first calculating kymographs from 2D time lapses by swapping dimensions (B1). Each kymograph is filtered, and all lines, corresponding to one particle trajectory, are segmented (B2). The angle of each line is then transformed to a particle velocity value, and aggregated into a speed histogram for each D-V position (B3). The flow profile is then calculated by extracting the mean and standard error of each histogram (C1). The flow profile can finally be fitted to our bidirectional flow model, to extract quantitative flow parameters (C2). Horizontal scale bars are 15 µm and vertical scale bar is 5 s. |
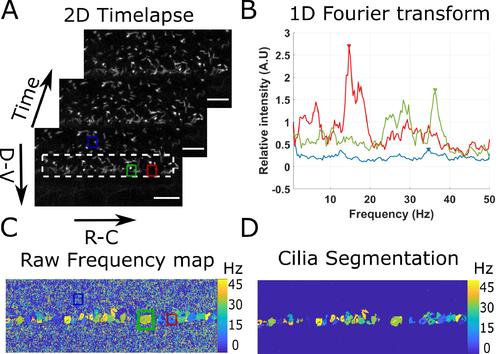
Principle of the beating cilia analysis. 2D time lapses of cilia beating (A) are analyzed by measuring the time Fourier transform at each pixel (B). 3 spectra corresponding to the pixel at the center of the three regions drawn in (A) are plotted. The frequency of the peak of maximum amplitude (arrows in (B)) is extracted for all spectra, to form a frequency map (C), showing regions of constant frequency corresponding to individual cilia. All cilia are then segmented by keeping only the largest regions of constant frequency (of area above 40 pixels) (D). Scale bar is 15 µm. |