
- Title
-
The adhesion GPCR Adgrg6 (Gpr126): Insights from the zebrafish model
- Authors
- Baxendale, S., Asad, A., Shahidan, N.O., Wiggin, G.R., Whitfield, T.T.
- Source
- Full text @ Genesis

Otic and myelination phenotypes in zebrafish adgrg6 mutants. (a) Phenotypically wild‐type sibling (left panel, ventral view) and homozygous adgrg6fr24−/− mutant (right panel, dorsal view), showing swollen otic vesicles (arrowhead). Anterior to the left. Note that head and eye size, pectoral fins, pigmentation, and swim bladder inflation are all normal in the mutant. Scale bar, 200 μm. Images reproduced from Geng et al., 2013. (b) In situ hybridization to myelin basic protein a (mbpa) transcripts in the trunk (top row) and to versican b (vcanb) in the ear (bottom row). Lateral views; anterior to the left. Top row: expression of mbpa in Schwann cells of the posterior lateral line ganglion (pllg, arrowhead) and posterior lateral line nerve (plln, arrow) is reduced in the hypomorphic tb233c allele, and lost altogether in the strong fr24 allele. The blurred stain to the left in each image is expression in the central nervous system, which is unaffected in the mutants. Scale bar, 100 μm. Images reproduced from Geng et al., 2013. Bottom row: strong expression of vcanb in the ear persists abnormally in adgrg6 mutants. Scale bar, 50 μm. dpf, days post fertilization. Images reproduced from Diamantopoulou et al., 2019 |
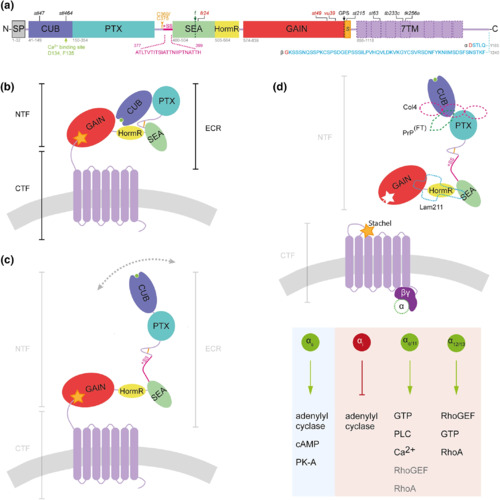
Schematic models of zebrafish Adgrg6 protein structure and mechanism of activation. (a) Zebrafish Adgrg6 protein sequence and domain organization, drawn to scale: signal peptide (SP), Complement C1r/C1s, Uegf, BMP1 (CUB), Pentraxin (PTX), Sperm protein, Enterokinase and Agrin (SEA), hormone receptor (HormR), GPCR autoproteolysis‐inducing (GAIN), Stachel sequence (S) and 7‐pass transmembrane (7TM, magenta) domains. The sequence of Adgrg6 splice isoforms is shown below the diagram: S1, including exon 6 (+SS, pink), and the short (α) and long (β) isoforms resulting from inclusion or exclusion, respectively, of exon 25 (amino acid sequence in blue; splice site in red). The two cysteine residues (C369, C375) that form a bond in the linker between PTX and SEA domain are shown in amber. Cleavage sites are highlighted by dotted lines: GPCR autoproteolytic site (GPS, black), and position of furin cleavage site in mammalian ADGRG6 (f, green). Positions of widely studied zebrafish mutations are shown above the diagram: truncating (nonsense) mutations in red; missense mutations in black. (b) Structure of Adgrg6 S2 isoform in closed conformation (not to scale). Domains correspond to those illustrated in (b); Ca2+ − binding site (green) within CUB domain, cell membrane (gray). (c) Structure of Adgrg6 S1 isoform in open conformation. (d) Overview of potential Adgrg6 Stachel activation mechanism (not to scale). Tethered Stachel sequence (amber star) self‐activates Adgrg6 following removal of NTF. The NTF is also thought to signal in trans (not shown). Known Adgrg6 NTF ligands (dashed shapes) include Collagen IV (pink, Col4), prion protein flexible tail (PrPFT, green), and Laminin‐211 (Lam211, turquoise). Signaling is transduced by various G protein α subunits activating intracellular pathways, elucidated from zebrafish Adgrg6 studies (light blue) and mouse or human ADGRG6 studies (light red). Diagrams are adapted from (Leon et al., 2020); the figure summarizes findings from this study and from (Geng et al., 2013; Küffer et al., 2016; Liebscher, Schön, et al., 2014; Lizano, Hayes, & Willard, 2021; Moriguchi et al., 2004; Paavola, Sidik, Zuchero, Eckart, & Talbot, 2014; Patra et al., 2013; Petersen et al., 2015) |

Design and proof‐of‐principle for a whole‐animal compound screen to identify agonists of the zebrafish Adgrg6 pathway. (a) Overview of screen pipeline. Batches of 100% homozygous embryos are dispensed into 96‐well plates, with three embryos (biological replicates) per well. Embryos are incubated in control and test compounds from a library of choice at an optimum time for rescue of the mutant phenotype. Effects of compounds on gene expression are measured by semi‐automated in situ hybridisation. (b) Example results from a two‐part in situ hybridization screen using the hypomorphic (adgrg6tb233c−/−) alelle. Here, an example hit compound (nifedipine, a dihydropyridine) reduces vcanb expression in the ear (top panels) and restores mpba expression in Schwann cells of the lateral line nerves in the vicinity of the ear. Several areas of mbpa expression are rescued, in particular that associated with the posterior lateral line ganglion (pllg, arrowhead). Lateral views; anterior to the left, dorsal to the top. Abbreviations: allg, anterior lateral line ganglion; c, expression associated with the sensory cristae of the ear; DMSO, dimethyl sulfoxide; dpf, days post fertilization; io, infraorbital ramus of the anterior lateral line nerve; pll‐d, pll‐v, dorsal and ventral rami of the posterior lateral line nerve; pllg, posterior lateral line ganglion. Scale bars, 50 μm (top row); 50 μm (bottom row). (c) Use of hypomorphic and strong alleles to differentiate hit compound classes in the vcanb expression assay. Effects of example compounds are shown. Colforsin, a forskolin derivative, rescues both alleles efficiently, and is likely to act downstream of the pathway to raise cAMP levels. Carapin‐8(9)‐ene rescues the hypomorph, but has no effect on the stronger fr24 allele. Compounds such as this may interact directly with the Adgrg6 receptor. Scale bar, 50 μm. Images reproduced from Diamantopoulou et al., 2019 |