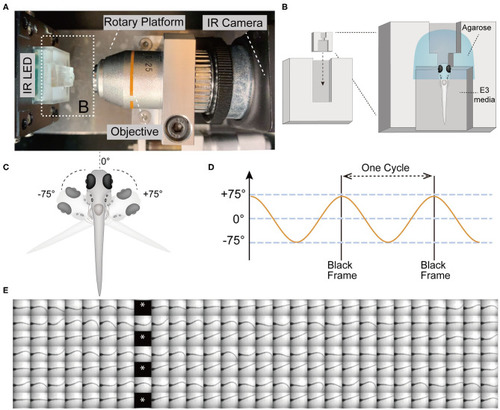
The VSR in zebrafish larvae at 5 days post-fertilization (5 dpf). (A) Infrared (IR) imaging acquisition system, which contains a rotary platform driven by a motor, an objective (10x), an IR LED beneath the chamber holder, and an IR camera. The white dotted box indicates the mounting chamber and chamber holder (B). (B) Diagram of a vertically mounted larva in the chamber unit. The larval head is embedded in 2% low melting point agarose and the trunk and pectoral fins are free to move in the E3 media. (C,D) The test device provides a yaw stimulus at 0.53 Hz and rotation of the head ±75°. (E) Still frames of four contiguous cycles of the evoked tail responses in a wild type larva are shown. Asterisks indicate black frames.

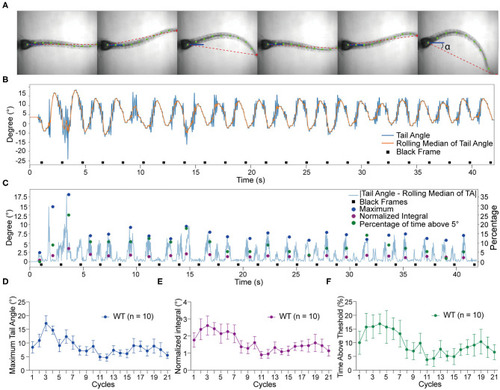
Tracking of tail movements using ZebraZoom software.
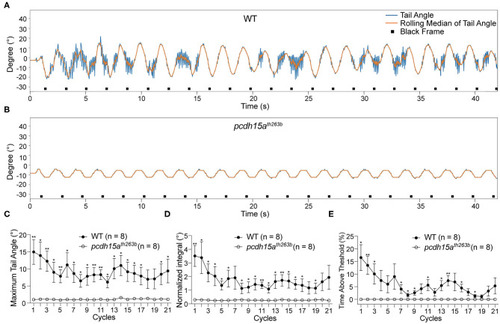
 (A) Six contiguous frames of tail movements from a wild type larva. ZebraZoom calculates the angle of the red dotted line and the horizontal line as real tail angle (α). (B) Representative tracking trace of tail movements from a wild type larva. (C) The output data of the maximum tail angle, normalized integral, and percentage of time above threshold are displayed as colored dots. (D–F) Group data of wild type larvae (n = 10) for maximum tail angle, normalized integral, and percentage of time above threshold. Means ± SEM are shown.

The VSR is absent in pcdh15a mutants that lack inner ear function. (A,B) Representative tracking traces of a wild type sibling and a pcdh15ath263b mutant. (C–E) The maximum tail angle, normalized integral and percentage of time above threshold show significant differences between wild type siblings (n = 8) and pcdh15ath263b mutants (n = 8). Mean ± SEM for each genotype was plotted and a two-way ANOVA with Benjamini-Hochberg correction was performed. *p < 0.05 and **p < 0.01.

The larval lateral line organ does not contribute to the VSR. (A,B) Representative tracking traces of a wild type sibling and a lhfpl5atm290d mutant. (C–E) The maximum tail angle, normalized integral and percentage of time above threshold are significantly reduced in lhfpl5atm290d mutants (n = 8) compared to wild type siblings (n = 8). (F,G) Representative VSR tracking traces show comparable tail movements in a wild type sibling and a lhfpl5bvo35 mutant. (H–J) The maximum tail angle, normalized integral, and percentage of time above threshold are comparable between wild type siblings (n = 7) and lhfpl5bvo35 mutants (n = 8). Mean ± SEM for each genotype was plotted and a two-way ANOVA with Benjamini-Hochberg correction was performed. *p < 0.05; **p < 0.01; and ***p < 0.001.

The VSR rapidly decreases over time in synj1 mutants. (A) Impaired balance in synj1Q296X mutants. The blue arc-shape arrow indicates the direction of the current. Yellow arrows indicate wild type siblings and white arrowheads indicate synj1Q296X mutants. (B,C) Representative tracking trace of a wild type sibling and a synj1Q296X larva. Note the tail movements during the initial cycles and then cessation of the reflex. (D–F) The maximum tail angle, normalized integral, and percentage of time above threshold show no significant difference during the initial cycles, but then dramatically decrease in synj1Q296X larvae. (G) The number of active cycles (default threshold was 5°) were reduced in synj1 mutants compared to wild type siblings. (H) The half time of the VSR in synj1Q296X larvae was significantly less compared to wild type siblings. Mean ± SEM for each genotype was plotted and a two-way ANOVA with Benjamini-Hochberg correction was performed. *p < 0.05; **p < 0.01; and ***p < 0.001.

Longer pauses in activity and increased recovery time required for the resumption of the VSR in synj1 mutants. (A) Diagram of prolonged yaw stimulation (252 s). (B) Representative tracking traces of responses. Note the paucity in activity in the mutant. (C,D) Percentage of active cycles and duration of pauses. synj1Q296X larvae display fewer active cycles and much longer recovery periods during prolonged stimulation. (E) Diagram of yaw stimulation with decreasing rest intervals. Six stimuli were given with rest periods in between each stimulus lasting 0–20 s (42 s per stimulus, 302 s in total). (F) The minimal time interval required to resume VSR activity. Mean ± SEM for each genotype was plotted and a two-way ANOVA with Benjamini-Hochberg correction was performed. ***p < 0.001.

Acknowledgments
This image is the copyrighted work of the attributed author or publisher, and ZFIN has permission only to display this image to its users. Additional permissions should be obtained from the applicable author or publisher of the image. Full text @ Front. Mol. Neurosci.