FIGURE SUMMARY
Title

Pancreatic progenitor epigenome maps prioritize type 2 diabetes risk genes with roles in development

Authors
Geusz, R.J., Wang, A., Chiou, J., Lancman, J.J., Wetton, N., Kefalopoulou, S., Wang, J., Qui, Y., Yan, J., Aylward, A., Ren, B., Dong, P.D.S., Gaulton, K.J., Sander, M.
Source
Full text @ Elife

Deletion of the <italic>LAMA1</italic>-associated pancreatic progenitor-specific enhancer does not affect pancreatic lineage specification.

(A) Odds ratio estimates (points) and 95% CIs (lines) for rs10502347 association with T2D and metabolic GWAS traits. Significant associations are colored black, non-significant are colored light grey. (B) Schematic illustrating CRISPR-Cas9-mediated deletion strategy of LAMA1-associated PSSE to generate independent ∆LAMA1Enh hESC clones with different DNA cleavage products. (C) Flow cytometry analysis for NKX6.1 and PDX1 comparing control and ∆LAMA1Enh PP2 cells. Isotype control (ISO) for each antibody is shown in red and target protein staining in green. Percentage of cells expressing each protein is indicated (representative experiment, n = 3 independent differentiations). (D) Immunofluorescent staining for NKX6.1 and PDX1 in control and ∆LAMA1Enh PP2 cells (representative images, n = 2 slides). Scale bar, 50 μm. (E) mRNA expression of pancreatic transcription factors determined by RNA-seq in control and ∆LAMA1Enh PP2 cells. Data are shown as mean of fragments per kilobase per million fragments mapped (FPKM) ± S.E.M. (n = 2 replicates from independent differentiations for control cells. ∆LAMA1Enh cells represent combined data from two clonal lines with two replicates for each line from independent differentiations. p adj. = 3.56 × 10−2, 0.224, 0.829, 8.14 × 10−2, and 0.142, for comparisons of PDX1, NKX6.1, PROX1, PTF1A, and SOX9, respectively; DESeq2; * p adj. <0.05, n.s., not significant). (F) Similarity matrix showing Pearson correlations for normalized transcriptomes (log transformed expression for genes with FPKM ≥1 in ≥1 replicates) in control and ∆LAMA1Enh PP2 cells (n = 2 independent differentiations for control cells and for each ∆LAMA1Enh clone). See also Figure 4—source datas 1 and 2.

Deletion of <italic>LAMA1</italic> does not affect pancreatic lineage specification.

(A) Schematic illustrating CRISPR-Cas9-mediated deletion strategy of LAMA1 to generate ∆LAMA1 hESC clonal line. (B) Immunofluorescent staining for Laminin in control and ∆LAMA1 PP2 cells (representative images, n = 2 independent slides). Scale bar, 50 μm. (C) Flow cytometry analysis for NKX6.1 and PDX1 comparing control and ∆LAMA1 PP2 cells. Isotype control (ISO) for each antibody is shown in red and target protein staining in green. Percentage of cells expressing each protein is indicated. (D) Immunofluorescent staining for NKX6.1 and PDX1 in control and ∆LAMA1 PP2 cells (representative images, n = 2 independent slides). Scale bar, 50 μm. (E) mRNA expression of pancreatic transcription factors determined by qPCR in control and ∆LAMA1 PP2 cells. Data are shown as mean ± S.E.M. (n = 3 replicates from independent differentiations. n = 3 technical replicates for each sample; p=2.19 × 10−2, 0.360, 6.25 × 10−2, 0.710, and 0.122 for comparisons of PDX1, NKX6.1, PROX1, PTF1A, and SOX9 expression in control compared to ∆LAMA1 PP2 cells, respectively; student’s t-test, two sided; n.s., not significant, *p<0.01). Each plotted point represents the average of technical replicates for each differentiation.

Deletion of the <italic>CRB2</italic>-associated pancreatic progenitor-specific enhancer does not affect pancreatic lineage specification.

(A) Schematic illustrating CRISPR-Cas9-mediated deletion strategy of CRB2-associated PSSE to generate independent ∆CRB2Enh hESC clones with different DNA cleavage products. (B) Flow cytometry analysis for NKX6.1 and PDX1 comparing control and ∆CRB2Enh PP2 cells. Isotype control (ISO) for each antibody is shown in red and target protein staining in green. Percentage of cells expressing each protein is indicated (representative experiment, n = 3 independent differentiations). (C) Immunofluorescent staining for NKX6.1 and PDX1 in control and ∆CRB2Enh PP2 cells (representative images, n = 2 independent slides). Scale bar, 50 μm. (D) mRNA expression of pancreatic transcription factors determined by RNA-seq in control and ∆CRB2Enh PP2 cells. Data are shown as mean of fragments per kilobase per million fragments mapped (FPKM) ± S.E.M. (n = 2 replicates from independent differentiations for control cells ∆CRB2Enh cells represent combined data from two clonal lines with two replicates for each line from independent differentiations. p adj. = 1.00, 1.00, 1.00, 1.00, and 1.00, for comparisons of PDX1, NKX6.1, PROX1, PTF1A, and SOX9, respectively; DESeq2; n.s., not significant). (E) Similarity matrix showing Pearson correlations for normalized transcriptomes (log transformed expression for genes with FPKM ≥1 in ≥1 replicates) in control and ∆CRB2Enh PP2 cells (n = 2 independent differentiations for control cells and for each ∆CRB2Enh clone). See also Figure 5—source data 1.

Deletion of <italic>CRB2</italic> does not affect pancreatic lineage specification.

(A) Schematic illustrating CRISPR-Cas9-mediated deletion strategy of CRB2 to generate ∆CRB2 hESC clonal line. (B) Immunofluorescent staining for CRB2 in control and ∆CRB2 PP2 cells (representative images, n = 2 independent slides). Scale bar, 50 μm. (C) Flow cytometry analysis for NKX6.1 and PDX1 comparing control and ∆CRB2 PP2 cells. Isotype control (ISO) for each antibody is shown in red and target protein staining in green. Percentage of cells expressing each protein is indicated. (D) Immunofluorescent staining for NKX6.1 and PDX1 in control and ∆CRB2 PP2 cells (representative images, n = 2 independent slides). Scale bar, 50 μm. (E) mRNA expression of pancreatic transcription factors determined by qPCR in control and ∆CRB2 PP2 cells. Data are shown as mean ± S.E.M. (n = 3 replicates from independent differentiations. n = 3 technical replicates for each sample; p=0.241, 0.971, 0.397, 0.374, and 0.311 for comparisons of PDX1, NKX6.1, PROX1, PTF1A, and SOX9 expression in control compared to ∆CRB2 PP2 cells, respectively; student’s t-test, two sided; n.s., not significant). Each plotted point represents the average of technical replicates for each differentiation.

Laminin and Crb are expressed in zebrafish pancreas progenitors.

(A,B) Confocal images of 36 hr post fertilization (hpf) Tg(ptf1a:eGFP)jh1 zebrafish foregut endoderm labeled with DAPI (nuclei, grey) and antibodies against Nkx6.1 (blue; pancreatic progenitors) and Laminin (A, red) or panCrb (B, red); n = 10 embryos stained. (A–A”’’) Z-focal plane image showing pancreatic progenitor cells marked by Nkx6.1 (blue) and low level ptf1a:eGFP, labeled with anti-Laminin antibodies (red). (B–B”’’) Pancreatic progenitors labeled with anti-panCrb antibodies (red). Scale bar, 20 µM.

EXPRESSION / LABELING:
Antibodies:
Fish:
Anatomical Term:
Stage: Prim-25

Validation of morpholinos targeting <italic>lama1</italic>.

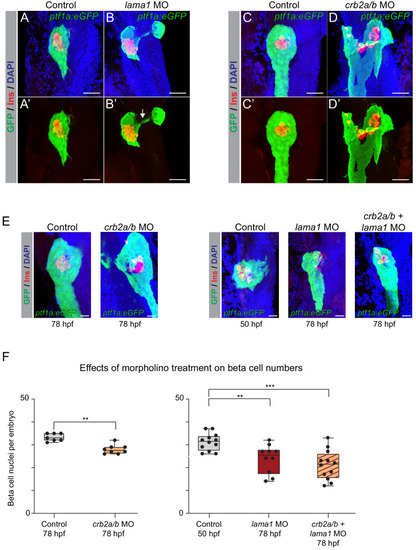
Confocal images (3D rendered) of 32–34 hpf Tg(ptf1a:eGFP)jh1 zebrafish foregut endoderm labeled with DAPI (nuclei, grey) and anti-Laminin antibodies (red). (A–A’’) Z-focal plane image of pancreatic progenitors marked by ptf1a:eGFP (green) and labeled with anti-Laminin antibodies (red) from embryos injected with non-targeting standard control morpholinos (n = 6). (B–B’’) Z-focal plane image showing loss of Laminin staining (red) in pancreatic progenitors marked by ptf1a:eGFP (green) from embryos injected with morpholinos targeting lama1 (n = 5/6). (C,D) 3D renderings of 45 hpf Tg(ptf1a:eGFP)jh1 zebrafish foregut endoderm labeled with antibodies against Nkx6.1 (blue) and Laminin (red). (C–C’’) Z-focal plane image of pancreatic progenitors marked by ptf1a:eGFP (green) and labeled with anti-Nkx6.1 (blue) and anti-Laminin (red) antibodies from embryos injected with standard control morpholinos (n = 4/4). (D–D’’) Z-focal plane image showing loss of Laminin staining (red) in pancreatic progenitors marked by ptf1:eGFP and labeled with anti-Nkx6.1 antibodies (blue) from embryos injected with morpholinos targeting lama1 (n = 3/4). Scale bar, 20 µM. Arrows highlight pancreatic progenitors marked by Laminin (red), Nkx6.1 (blue) and ptf1a:eGFP. MO, morpholino.

EXPRESSION / LABELING:
Antibody:
Fish:
Knockdown Reagent:
Anatomical Term:
Stage Range: Prim-15 to High-pec
PHENOTYPE:
Fish:
Knockdown Reagent:
Observed In:
Stage Range: Prim-15 to High-pec

Validation of morpholinos targeting <italic>crb2a</italic> and <italic>crb2b</italic>.

(A,B) 3D renderings of 32–34 hpf Tg(ptf1a:eGFP)jh1 zebrafish foregut endoderm labeled with DAPI (nuclei, grey) and anti-Crb2a antibodies (red). (A–A’’) Z-focal plane image showing Crb2a labeled (red) foregut endoderm from embryos injected with standard control morpholinos (n = 6). (B–B’’) Z-focal plane image showing loss of Crb2a staining (red) in the foregut endoderm from embryos injected with morpholinos targeting crb2a (n = 6/6). (C,D) 3D renderings of 45 hpf Tg(ptf1a:eGFP)jh1 zebrafish foregut endoderm labeled with DAPI (nuclei, grey) and anti-Crb2a antibodies (red). (C–C’) Z-focal plane image showing Crb2a-labeled (red) embryos injected with standard control morpholinos (n = 3). (D–D’) Z-focal plane image showing loss of Crb2a staining (red) in embryos injected with morpholinos targeting crb2a (n = 3/3).(E,F) 3D renderings of 32–34 hpf Tg(ptf1a:eGFP)jh1 zebrafish foregut endoderm labeled with DAPI (nuclei, grey) and anti-panCrb antibodies (red). (E–E’’) Z-focal plane image showing pancreatic progenitors marked by ptf1a:eGFP (green) and labeled with anti-panCrb antibodies (red; white arrows) from embryos injected with standard control morpholinos (n = 8). (F–F’’) Z-focal plane image showing reduced panCrb (red) staining in pancreatic progenitors marked by ptf1a:eGFP (green) from embryos injected with morpholinos targeting both crb2a and crb2b (n = 4/5). (G,H) 3D renderings of 45 hpf Tg(ptf1a:eGFP)jh1 zebrafish foregut endoderm labeled with anti-Nkx6.1 (blue) and anti-panCrb (red) antibodies. (G–G’’) Z-focal plane image showing pancreatic progenitors marked by ptf1a:eGFP (green) and labeled with anti-Nkx6.1 (blue) and anti-panCrb (red; white arrows) antibodies from embryos injected with standard control morpholinos (n = 4). (H–H’’) Z-focal plane image showing reduced panCrb (red) staining in pancreatic progenitors marked by ptf1a:eGFP and labeled with anti-Nkx6.1 antibodies (blue) from embryos injected with morpholinos targeting both crb2a and crb2b (n = 3/4). Yellow arrows denote dorsal pancreas where panCrb labeling remains in control injected embryos, possibly due to expression of alternate Crb proteins present within the dorsal pancreas. Scale bar, 20 µM. MO, morpholino.

ZFIN is incorporating published figure images and captions as part of an ongoing project. Figures from some publications have not yet been curated, or are not available for display because of copyright restrictions.

Acknowledgments
This image is the copyrighted work of the attributed author or publisher, and ZFIN has permission only to display this image to its users. Additional permissions should be obtained from the applicable author or publisher of the image. Full text @ Elife