
- Title
-
Efficient clofilium tosylate-mediated rescue of POLG-related disease phenotypes in zebrafish
- Authors
- Facchinello, N., Laquatra, C., Locatello, L., Beffagna, G., Brañas Casas, R., Fornetto, C., Dinarello, A., Martorano, L., Vettori, A., Risato, G., Celeghin, R., Meneghetti, G., Santoro, M.M., Delahodde, A., Vanzi, F., Rasola, A., Dalla Valle, L., Rasotto, M.B., Lodi, T., Baruffini, E., Argenton, F., Tiso, N.
- Source
- Full text @ Cell Death Dis.
|
|
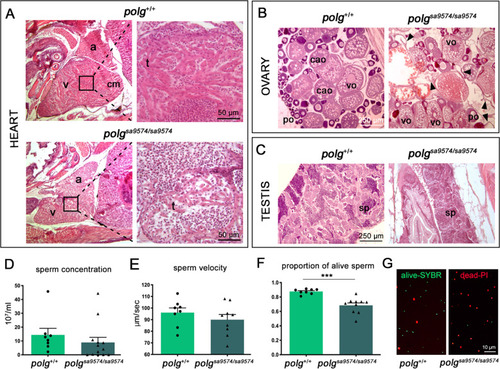
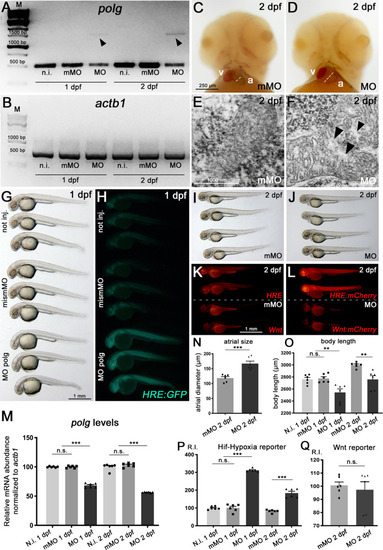
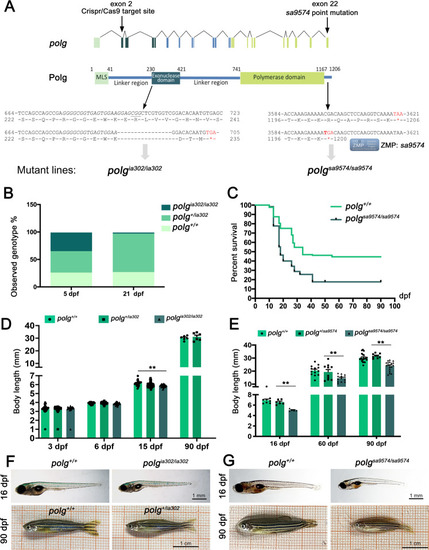
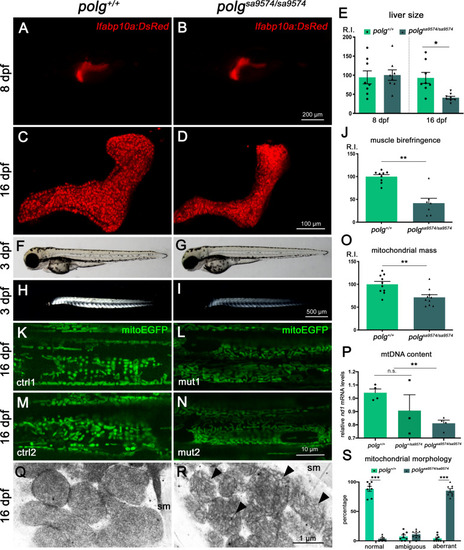
PHENOTYPE:
|
EXPRESSION / LABELING:
PHENOTYPE:
|

|
|

ZFIN is incorporating published figure images and captions as part of an ongoing project. Figures from some publications have not yet been curated, or are not available for display because of copyright restrictions. PHENOTYPE:
|
|
ZFIN is incorporating published figure images and captions as part of an ongoing project. Figures from some publications have not yet been curated, or are not available for display because of copyright restrictions. |