FIGURE SUMMARY
Title

Disruption of Abcc6 Transporter in Zebrafish Causes Ocular Calcification and Cardiac Fibrosis

Authors
Sun, J., She, P., Liu, X., Gao, B., Jin, D., Zhong, T.P.
Source
Full text @ Int. J. Mol. Sci.

Generation of abcc6a mutants and expression patterns in zebrafish. (A) Schematic of the zebrafish abcc6a gene. Left and right arms of TALEN targeting exon 2 are color-coded to represent 4 repeat-variable diresidues (RVDs) (red, NI = A; green, NN = G; blue, NG = T; orange, HD = C). Nucleotides in red letters and underlined indicate TALEN target sequence. Selected StuI site in the spacer is highlighted with violet. Genomic loci including StuI site is targeted using primer pairs P1 and P2. (B) Deletion mutations generated by TALEN at the abcc6a gene. The WT sequence is shown at the top. Deletions are indicated by the black dashes. Red letters represent partial TALEN target sequences. Sequences are organized as sets of three bases of in-frame codons. (C) Domain structure and predicted amino acid sequence of WT and TALEN mutants. Gray shade indicates regions missing in the mutant proteins. All mutants contain premature stop codon resulting in a lack of most of Abcc6a domains. (D1D3) Lateral views showing embryo morphology of abcc6aΔ1/Δ1 (D2) and abcc6aΔ2/Δ2 mutants (D3) and WT siblings (D1) at 4 dpf. (E1E3) Whole-mount in situ hybridization (WISH) analysis of abcc6a expression at 4 dpf in abcc6aΔ1/Δ1 (E2) and abcc6aΔ2/Δ2 mutants (E3) and wild-type siblings (E1). (F,G) abcc6a expression levels were examined using real-time PCR analysis in abcc6aΔ1/Δ1 and abcc6aΔ2/Δ2 mutant larvae at7 dpf (F) and adult hearts (G). Expression levels were normalized to the expression of β-actin. Data are mean ± SEM from 20 larvae and 6 hearts for each group. ** p < 0.01, *** p < 0.001, Student’s t-test (unpaired, two-tailed). (H) Western blot analysis showing ABCC6 protein levels in abcc6aΔ1/Δ1 and abcc6aΔ2/Δ2 mutants and WT larvae at 7 dpf. (IK) WISH showing ubiquitous abcc6a expression at the two-cell stage (I), the 80%-epiboly stage (J), and 8 somite stages (K). Blue arrow indicates dorsal forerunner cells (J) and black arrow indicates Kupffer’s vesicle (K). (L,M) abcc6a is detected in the pronephric duct (L; lime arrowhead), aorta-gonad-mesonephros (AGM) region (L; green arrow), midbrain–hindbrain boundary and hindbrain (L, M; green bracket) and otic vesicle (L, M; orange arrow). (N) At 48 hpf, abcc6a expression is detected in the heart (red arrow), opercula (green arrow), cleithrum (white arrow), and ear (yellow arrow). (O,P) Lateral views of the abcc6a transcripts expression in frozen sections of heart (O) and notochord (P) at 4 dpf. Pink dashes indicate heart outlines. V, ventricle. A, atrium. (Q,R) abcc6aΔ1/Δ1 mutants exhibit malformed adult body axis curvature and short body length at 8 months post fertilization (mpf). Dotted red line indicates extent of the skull uplift. Small compartment represents 1 mm. (SV) Micro-CT(MCT) scan (S,U) and Alizarin Red staining (ARS; T, V) of WT and abcc6aΔ1/Δ1 mutants showing vertebral hyperossification. (W,X) Quantification of the centrum bone volume (W) and bone mineral density (X) in abcc6aΔ1/Δ1 and abcc6aΔ2/Δ2 mutants. *** p < 0.001, Student’s t-test (unpaired, two-tailed). Scale bar: 1mm (D1D3, E1E3); 200 μm (IK, O, P, SV); 500 μm (L,N); 500 μm (M).

abcc6a mutants display ectopic calcification in the eyes. (AD) Immunofluorescence results show that Abcc6 is located in the vascular-rich choroidal tissues by co-localization staining (red arrow) of Tg (flk: mcherry) fish. (E,F) Whole mount Alizarin Red staining shows ectopic scleral calcification in isolated eyes of abcc6aΔ1/Δ1 mutants. (GI; G1I1) Alizarin Red staining shows that the scleral layer of the abcc6aΔ1/Δ1 and abcc6aΔ2/Δ2 mutant eyes displays an accumulation of abnormal calcification (H,I; H1,I1) compared to WT (G,G1). (G1I1) Higher-magnification images of the dashed boxes in (GI). Red arrow marks abnormal calcification of scleral layer in the abcc6aΔ1/Δ1 mutant eyes. (JM) Transmission electron microscopy showing abnormal thickening and enrichment of dense electron core of Bruch’s membrane in abcc6aΔ1/Δ1 mutant eyes (L), compared with WT eyes (J). (K,M) Higher-magnification images of the dashed boxes in (J,L). Black brackets indicate the position of BM, and red arrow indicates position of dense electron core. RPE, retinal pigment epithelium; BM, Bruch’s membrane; CC, choriocapillaris; OS, outer segment; RBC, red blood cell. (N) Quantification of area of calcification of sclera of WT (n = 7), abcc6aΔ1/Δ1 (n = 7) and abcc6aΔ2/Δ2 fish (n = 7). ** p < 0.001, Student’s t-test (unpaired, two-tailed). (O) Quantification of Bruch’s membrane thickness of WT (n = 6, 10 measuring points per sample) and abcc6aΔ1/Δ1 (n = 6, 10 measuring points per sample) fish. *** p < 0.001, Student’s t-test (unpair, two-tailed). Scale bar: 250 μm (A,C; E,F; GI); 200 μm (B,D);62.5 μm (G1I1); 2 μm (J,L); 0.5 μm (K,M).

abcc6aΔ1/Δ1 mutation upregulates extracellular matrix genes and leads to fibrotic adult hearts. (A,B) Whole-mounted photographs of adult heart at 8 mpf showing cardiac shrinkage and fibrosis phenotypes in abcc6aΔ1/Δ1 (B), compared with WT sibling heart (A). (C,D) Abcc6 protein (red) recognized with anti-Abcc6 antibody overlaps with endocardial cells marked by flk:EGFP (green) in adult Tg(flk:EGFP) heart. Arrows in (C,D) point to endocardial cells expressing Abcc6. (E,F) Hematoxylin-eosin (HE) staining exhibits thinner compact layer and fewer myocardial cells in abcc6aΔ1/Δ1 heart (F), compared to WT sibling hearts (E). (G,H) Representative Picrosirius Red staining of heart sections (yellow for cardiomyocyte fiber, red for collagen) shows superfluous collagen and elastin deposition residing in a compact layer and trabeculae in abcc6aΔ1/Δ1 adult hearts (H), compared to WT hearts (G). (I,J) Immunofluorescent section images of abcc6aΔ1/Δ1 mutant hearts (J) and WT siblings (I), stained with anti-Mef2 antibody. (K) Quantitative analysis shows a thinner compact layer thickness in abcc6aΔ1/Δ1 adult heart (n = 10, 4 measuring points per sample), compared with WT sibling heart (n = 10, 4 measuring points per sample). *** p < 0.001, Student’s t-test (unpaired, two-tailed). (L) Quantification of the number of cardiomyocyte cells in the same area of WT (n = 9) and abcc6aΔ1/Δ1 mutants (n = 9). **** p < 0.0001, Student’s t-test (unpaired, two-tailed). (M) Volcano plots showing differentially expressed genes. 1471 genes are increased in abcc6aΔ1/Δ1 mutant hearts and 599 genes expression are reduced, compared to WT hearts. (N) Heat map indicates genes upregulated in abcc6aΔ1/Δ1 mutant hearts, compared to WT hearts (higher expression in red, lower expression in blue). FC > 1.5, p < 0.05. (O) qPCR analyses of tenascin family genes (tnr and tnc) and fibronectin b and collagen family genes (col4a5, col12a1a, col12a1b and col17a1b) in hearts extracted from abcc6aΔ1/Δ1 and abcc6+/+ animals. Data presented as mean ± SEM, n = 3, * p < 0.05, ** p < 0.01, *** p < 0.001, Student’s t-test (unpaired, two-tailed). (P,Q) Immunostaining analyses reveal a robust collagen I in abcc6a mutant hearts (Q), compared to that in WT hearts (P), stained with anti-Col1a (red) and anti-cTnT antibodies (green). (R,S) Immunostaining analyses show pervading Fibronectin in compact and trabecular layers in abcc6aΔ1/Δ1 hearts (S) compared to WT hearts (R), stained with anti-Fibronectin (red) and anti-MF20 antibodies (green). Scale bar: 100 μm (A,B; G,H; R,S); 50 μm (E,F); 20 μm (P,Q).

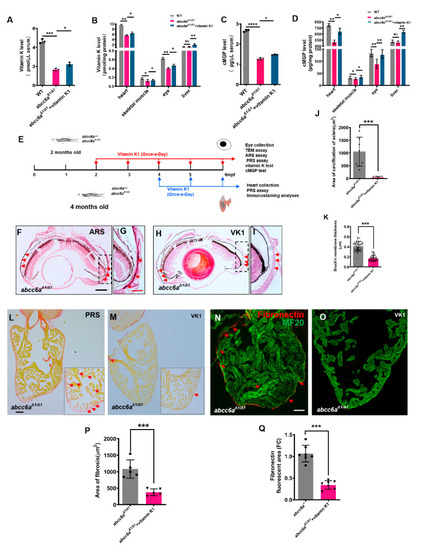
Vitamin K treatment relives ocular calcification and cardiac fibrosis in abcc6aΔ1/Δ1 mutants. (AD) Graphical representation of sandwich ELISA measurements for tissue and serum vitamin K and cMGP levels in WT (n = 18) and DMSO/ethanol- (n = 18) or vitamin K1-treated abcc6aΔ1/Δ1 fish (n = 18) fish. * p < 0.05, ** p < 0.01, *** p < 0.001, **** p < 0.0001, Student’s t-test (unpaired, two-tailed). (E) Experimental design for once-a-day DMSO/ethanol (0.1%) and vitamin K1 (80 µM) treatment of abcc6a+/+ and abcc6aΔ1/Δ1 fish. Red arrows indicate experimental steps, changing water every day for 4 months from 2 months old; for eye collection, TEM, ARS, and PRS assay, vitamin K and cMGP tests. Blue arrows indicate experimental steps for heart collection, PRS assay and immunostaining analyses for 2 months from 4 months of age. (FI) Vitamin K rescues abnormal scleral calcification in abcc6aΔ1/Δ1 mutant zebrafish. (G,I) Higher-magnification images of the dashed boxes in (F,H). Dashed black line indicates approximate plane of resection. Red arrow marks abnormal calcification of scleral layer in the abcc6aΔ1/Δ1 mutant eyes. (J) Quantification of area of calcification of sclera after 4 months of DMSO/ethanol (n = 7) or vitamin K1 treated treatment in abcc6aΔ1/Δ1 fish (n = 7). *** p < 0.001, Student’s t-test (unpaired, two-tailed). (K) Quantification of Bruch’s membrane thickness after 4 months of DMSO/ethanol (n = 13, 8 measuring points per sample) or vitamin K1 treatment in abcc6aΔ1/Δ1 fish (n = 15, 8 measuring points per sample). *** p < 0.001, Student’s t-test (unpaired, two-tailed). (L,M) Picrosirius Red staining of heart sections shows significantly reduced collagen deposition reside in the compact layer and trabeculae after treatment with vitamin K1 (M), as compared to abcc6aΔ1/Δ1 mutant hearts after treatment with DMSO/ethanol (L). Red for collagen (L; Red arrow) and yellow for cardiomyocyte fiber. (N,O) Immunofluorescent section images of adult ventricles stained with anti-Fibronectin and anti-MF20 antibodies from DMSO/ethanol-treated (N) or vitamin K1 treated abcc6aΔ1/Δ1 mutant fish (O), showing that vitamin K reduces Fibronectin. (P) Quantification of area of fibrosis after 2 months of DMSO/ethanol (n = 5) or vitamin K1 treatment in abcc6aΔ1/Δ1 fish (n = 5). *** p < 0.001, Student’s t-test (unpaired, two-tailed). (Q) Quantification of Fibronectin fluorescent area after 2 months of DMSO/ethanol (n = 7) or vitamin K1 treatment in abcc6aΔ1/Δ1 fish (n = 7). *** p < 0.001, Student’s t-test (unpaired, two-tailed). Scale bar: 250 μm (F,H); 50 μm (LO); 125 μm (G,I).

Acknowledgments
This image is the copyrighted work of the attributed author or publisher, and ZFIN has permission only to display this image to its users. Additional permissions should be obtained from the applicable author or publisher of the image. Full text @ Int. J. Mol. Sci.