
- Title
-
Coding Variants Coupled With Rapid Modeling in Zebrafish Implicate Dynein Genes, dnaaf1 and zmynd10, as Adolescent Idiopathic Scoliosis Candidate Genes
- Authors
- Wang, Y., Liu, Z., Yang, G., Gao, Q., Xiao, L., Li, J., Guo, C., Troutwine, B.R., Gray, R.S., Xie, L., Zhang, H.
- Source
- Full text @ Front Cell Dev Biol
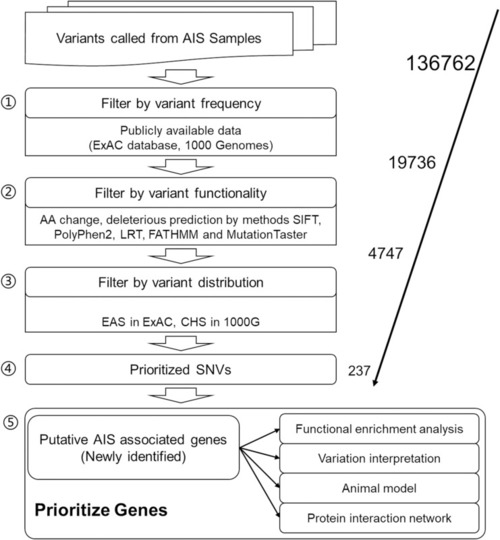
Workflow of adolescent idiopathic scoliosis (AIS) associated variant study. |

The variants identified from Southern Chinese AIS patients. (A) Genetic variations detected in gene families and related biological processes (BPs). Each row represents an individual gene family or BP category. The altered individuals and frequency of each gene are noted on the left. Each column representing an affected sample with clinical features is indicated by the color key. The occurrence of a variant with gene in corresponding terms across an individual sample is shown by a red (missense variant) or blue (no variant) color scheme. Sex, F = female, M = male. Main curve direction represents the sideness of the major curve, L = left, R = right. Location of the apical vertebra represents the axial location of the apical vertebrae, 1 = T1–T9 vertebrae, 2 = under the T10 vertebra. Curve shape, C = “C”-shaped curve, S = “S”-shaped curves. Cobb angle, 1 = below the mean Cobb angle, 2 = above the mean Cobb angle. Lenke type, 1 = type 1, 2 = type 2, 3 = type 3, 4 = type 4, 5 = type 5, and 6 = type 6. (B) The top 10 enriched Gene Ontology (GO) BP terms in our study. (C) The top enriched gene families with the genes in previous studies or database. (D) The top enriched gene families with the genes reported in our study. |

Structural interpretation of genetic alteration in putative adolescent idiopathic scoliosis (AIS)-related genes. (A) Lollipop plot for mapping mutations on the linear protein and its domains. P256L is the significant amino acid change caused by single nucleotide variants (SNVs) on DNAAF1. (B) Deleterious prediction by |

CRISPR/Cas9 knockout of candidate genes in zebrafish recapitulate the scoliosis phenotype. (A) Representative phenotypes of zebrafish larvae 3 dpf (days postfertilization) that were injected with multiplexed CRISPR/Cas9 reagents to target mutagenesis to candidate adolescent idiopathic scoliosis (AIS) associated genes. (B) Histograms representing the total percentage of curve body phenotype assessed at 3 and 5 dpf after injection is shown in the bar graph with red color. The number of larval fish assessed for each targeted gene is displayed in each set of bars. (C) Bright-field images (left) and Alizarin red/Alcian Blue stained (right) zebrafish ( PHENOTYPE:
|

Correlation between clinical features and Gene Ontology (GO) enrichment analysis of clinical feature-related variants. (A) The association between each clinical feature is depicted. The strength of the association is represented by the intensity of the red color. (B) Venn diagram of the distribution of each clinical feature-related variant as identified in our study (blue circle = location of apical vertebrae, yellow circle = Cobb angle, green circle = main curve direction, and pink circle = number of tilted vertebrae). (C) GO enrichment analysis of the filtered variants was performed. GO biological process (BP) annotation is indicated on the left. Each individual box represents a clinical characteristic. The –Log10 ( |
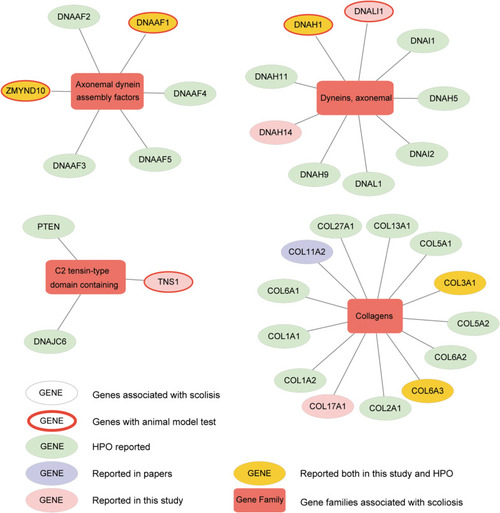
Altered genes and gene families in adolescent idiopathic scoliosis (AIS). The four gene families significantly enriched with mutated genes (Fisher exact test, adjusted |