FIGURE SUMMARY
Title

Circadian regulation of muscle growth independent of locomotor activity

Authors
Kelu, J.J., Pipalia, T.G., Hughes, S.M.
Source
Full text @ Proc. Natl. Acad. Sci. USA

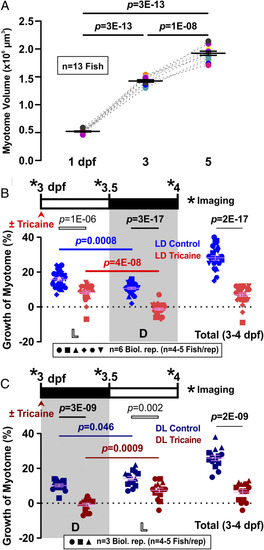
Diurnal variation and requirement for activity in volumetric growth of the myotome. (A) Growth of myotome in somite 17 between 1 and 5 dpf. Black bars represent mean ± SEM. Colors represent different individual fish from a single lay (n = 13 fish). (B and C) Larvae raised under LD (B; n = 25 or 26 fish from six biological replicates) or DL (C; n = 14 or 15 fish from three biological replicates) were either untreated (Control, blue/dark blue) or anesthetized (Tricaine, red/dark red) from 3 dpf to 4 dpf. Confocal imaging was performed every 12 h (*) over the 24-h period to measure myotome volume. Graphs show growth of myotome (percent) of individual fish over each 12-h period (left and center) or the full 24 h (right). Complete data on the same LD fish are shown in SI Appendix, Fig. S2 A and B. Symbol shapes distinguish biological replicates from separate lays. L, light; D, dark.

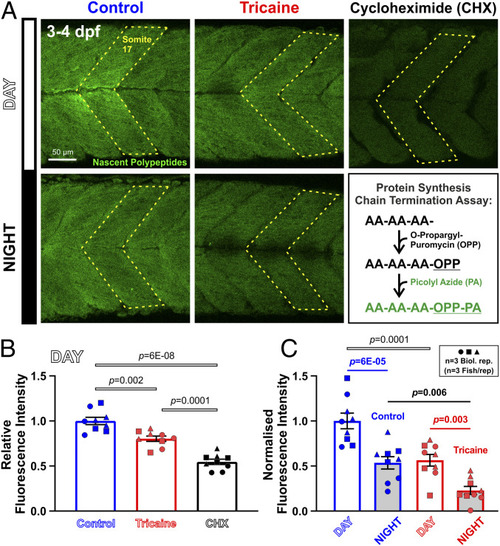
Diurnal variation and effect of activity in muscle protein synthesis. Larvae raised under LD that were either untreated (Control, blue) or anesthetized (Tricaine, red) at 3 dpf, and then treated with OPP for 2 h from ZT0 to ZT2 (Day) or ZT12 to ZT14 (Night). (A) Nascent proteins visualized by confocal microscopy. Box schematizes amino acid (AA) chain termination by OPP and detection with PA. Larvae treated with CHX and OPP from 3 dpf were analyzed at ZT2 as a negative control. (B and C) Quantification of OPP−PA fluorescence of somite 17 (n = 9 fish from three biological replicates). Signals were normalized to Control ZT0 to ZT2 samples (B), and compared after subtraction of CHX background (C). Symbols distinguish fish from different lays.

TORC1 signaling varies diurnally and is required for activity-driven daytime growth. Larvae raised under LD that were either untreated (Control, blue) or anesthetized (Tricaine, red) from 3 dpf to 4 dpf. (A) Western analysis of phospho-ribosomal protein S6 (pS6), total RpS6 (S6), and Histone H3 loading control (H3) in total protein extracted from whole larvae every 6 h over a 24-h period between 3 dpf and 4 dpf, at ZT3, ZT9, ZT15, and ZT21. (B) Quantification of pS6/S6 ratio (n = 3 biological replicates, shown in SI Appendix, Fig. S5). Ratios were normalized to control samples at ZT3. (C) Growth of the myotome (percent) in larvae that were also treated with either DMSO vehicle (light colors) or 10 µM rapamycin (dark colors). Symbols represent distinct lays (n = 15 fish, from three biological replicates). Note that DMSO data strengthen the result in Fig. 1B.

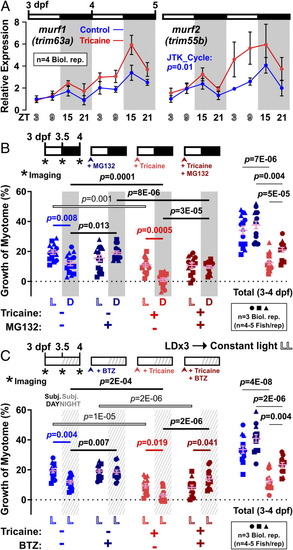
Nocturnal peak in atrogene expression parallels enhanced muscle growth at night in response to proteasome inhibitors. Larvae raised under LD were either untreated (Control, blue) or anesthetized (Tricaine, red). (A) Expression of atrophy-related genes murf1/trim63a and murf2/trim55b was assayed by qPCR on total RNA collected every 6 h between 3 and 5 dpf (n = 4 biological replicates); ef1a was used for normalization. Statistic represents JTK_Cycle (see Methods). (B) Growth of myotome (percent) in larvae that were also treated from 3 dpf with either DMSO vehicle (light colors) or 10 µM MG132 (dark colors). Symbols represent distinct lays (n = 14 or 15 fish from three biological replicates). (C) Growth of myotome (percent) in larvae that were entrained under LD and then at 3 dpf transferred to constant light (LD→LL) and simultaneously treated with either DMSO vehicle (light colors) or 1 µM BTZ (dark colors). Symbols represent distinct lays (n = 13 fish from three biological replicates). Note that DMSO data strengthen the result in Fig. 1B.

Circadian variation in muscle growth and metabolism is required for volumetric growth of myotome. (A) Sibling larvae collected within 1 h to 2 h of fertilization were reared under LL or DD light regimes to prevent circadian entrainment and compared to LD, as schematized. Myotome volume was measured at 3 dpf (n = 29 to 63 fish, from three to five biological replicates). Symbols represent distinct lays (biological replicates). Orange bars represent mean ± SEM; black boxes represent global mean. Note consistent effect despite lay-to-lay variation in absolute size. (B) Circadian variation in growth of myotome (percent) in larvae raised under three cycles of LD and then switched to LL between 3 and 4 dpf (LD→LL) that were either unanesthetized (Control, dark blue) or anesthetized from 3 dpf to 4 dpf (Tricaine, dark red). Symbols represent distinct lays (n = 15 fish from three biological replicates). (C) Circadian variation in nascent protein synthesis visualized at CT0 to CT2 (subjective day) and CT12 to CT14 (subjective night) between 3 and 4 dpf, in larvae that were raised under LD→LL. Graph shows quantification of OPP−PA fluorescence of somite 17 (n = 9 fish from three biological replicates). Signals were normalized to Control CT0 to CT2 samples after subtraction of CHX background. Symbols represent distinct lays. (D) Persistent circadian variation in expression of clock genes, bmal1a and per1b, and atrophy-related genes murf1 and murf2, between 3 and 4 dpf in larvae raised under LD→LL (n = 3 biological replicates; black solid lines); ef1a was used for normalization. Representative traces from LD fish in separate experiments are shown as references (gray dashed lines).

Dominant negative clock (ΔCLK) reduces daytime and enhances nighttime growth of the myotome. Control EGFP (light blue) and ΔCLK (dark blue) mRNA-injected larvae were raised under LD and analyzed between 3 and 4 dpf. (A) Design of EGFP (Control) and dominant negative CLOCK-5xMyc (ΔCLK) constructs, and their corresponding EGFP accumulation at 4 dpf after mRNA microinjection at one-cell stage. (B) Western analysis between 3 and 4 dpf using c-Myc antibody showing persistent presence of ΔCLK protein in ΔCLK-expressing larvae, but not in EGFP Control larvae. Histone H3 was used as loading control. (C) Diurnal variation in level of per1b mRNA prevented by ΔCLK (n = 3 biological replicates); ef1a was used for normalization. Note that Control strengthens result shown in Fig. 5D and SI Appendix, Fig. S7B. (D) Absolute myotome volume measured at 3 dpf in α-actin:mCherryCAAX larvae (shown in SI Appendix, Fig. S9A) is reduced by ΔCLK (n = 29 fish from three biological replicates). (E) Growth of the myotome (percent) in either unanesthetized (blue) or anesthetized from 3 dpf to 4 dpf (red) in ΔCLK (dark colors) or Control (light colors) (n = 14 or 15 fish from three biological replicates). Symbols represent distinct lays. Note that Control data strengthen the result in Fig. 1B.

Effects of ΔCLK expression on protein metabolism in zebrafish larvae. Control (light blue) and ΔCLK (dark blue) larvae were raised under LD and analyzed between 3 and 4 dpf. (A) Quantification of nascent protein visualized in somite 17 by OPP incorporation at ZT0 to ZT2 and ZT12 to ZT14 (n = 9 fish from three biological replicates; confocal images shown in SI Appendix, Fig. S9C). Signals were normalized to Control ZT0 to ZT2 samples after subtraction of CHX background. (B) Quantification of pS6/S6 ratio at ZT3 and ZT15 (n = 3 biological replicates). Ratios were normalized to control samples at ZT3. Symbols represent distinct lays (biological replicates shown in SI Appendix, Fig. S9D). (C) Diurnal variation in level of atrophy-related genes murf1 and murf2 (n = 3 biological replicates); ef1a was used for normalization. Control strengthens results in Fig. 4A; ΔCLK lacks peak at ZT15. (D) Growth of the myotome (percent) measured between 3 and 4 dpf in α-actin:mCherryCAAX Control (light colors) and ΔCLK (dark colors) larvae that were treated from 3 dpf with either DMSO vehicle (blue), 10 µM rapamycin (orange), or 10 µM MG132 (green). Symbols represent distinct lays (n = 12 fish from three biological replicates). Note that, although the effect of ΔCLK alone to increase nighttime growth did not reach the cutoff for significance in this experimental series (P = 0.36) or that in Fig. 6E (P = 0.47), when both datasets were pooled, ΔCLK caused a significant increase in growth at night (P = 0.022). Similar pooled analysis of the reduction by ΔCLK of daytime growth also increased confidence in the difference (P = 2E-06).

Models of how balance of anabolism and catabolism yields observed muscle growth through interaction of circadian and physical activity-dependent regulation. (A) Circadian muscle growth model. The y axis represents net protein turnover of cellular material, that is, hypertrophy (positive) or atrophy (negative). The x axis represents condition. Observed (and predicted net, from summed colored bars) growth over 12-h period is shown above (numbers in purple). Blue represents anabolism driven by activity. Green represents circadian clock-driven anabolism that is increased during the day. Striped blue and/or green represent the cooperative requirement of the two components, activity and clock, to drive extra daytime growth. Red represents catabolism induced by the circadian clock at night. Yellow represents activity- and clock-independent basal intrinsic anabolism/growth. During a normal LD cycle (Upper), in the presence of activity, muscle growth is fastest in the day, as physical activity cooperates with circadian clock to drive extra daytime anabolism. At night, anabolism reduces and catabolism increases, leading to slower growth, but activity still promotes some growth. In the absence of activity, muscle growth is still faster in the day than at night, although anabolism is reduced. This is because clock still drives nocturnal catabolism, but is insufficient to drive extra daytime anabolism for maximal growth (see striped green surrounded by dashed line). In the absence of a functional clock (Lower), muscle growth in the day is reduced compared with active control, because physical activity alone is insufficient to drive extra anabolism for maximal growth (see striped blue surrounded by dashed line). Growth at night, however, increases as nocturnal catabolism is eliminated. In the absence of activity, muscle growth in the day is unaltered when compared with inactive control. At night, growth again increases, due to the elimination of nocturnal catabolism. Hence, growth is similar between day and night in inactive ΔCLK muscle. Overall, optimal growth and protein turnover is only achieved in active muscle with a functional clock. (B) Proposed mechanisms of clock regulation of metabolism. Gray arrows, daytime pathways; black arrows, nighttime pathways. Note that TORC1 activity is not absolutely required for anabolism/growth; TORC1 activity, however, permits extra anabolism and hence faster growth in the day (blue dashed box), but only when both physical activity and clock are present (green dashed box).

Acknowledgments
This image is the copyrighted work of the attributed author or publisher, and ZFIN has permission only to display this image to its users. Additional permissions should be obtained from the applicable author or publisher of the image. Full text @ Proc. Natl. Acad. Sci. USA