FIGURE SUMMARY
Title

Hedgehog signaling regulates neurogenesis in the larval and adult zebrafish hypothalamus

Authors
Male, I., Ozacar, A.T., Fagan, R.R., Loring, M.D., Loring, M.D., Shen, M.C., Pace, V.A., Devine, C.A., Lawson, G.E., Lutservitz, A., Karlstrom, R.O.
Source
Full text @ eNeuro

Shh-producing and Hh-responsive radial glial cells in the adult hypothalamus are proliferative neural precursors. A, Schematic sagittal, transverse, and horizontal sections through the adult zebrafish brain. B, Optical sections from a whole-brain light-sheet confocal image of a Tg(GBS-ptch2:NLS-mCherry;shha:GFP) double transgenic adult showing Hh-responsive cells (Hh-resp, red) in relation to Shh-producing cells (Shh-Prod, green) in the LR and PR of the adult hypothalamic (third) ventricle. Shh-expressing cells are adjacent to Hh-responsive cells in the ventricular zone of both recesses. Yellow lines in each panel indicate the plane of section in the other panels. Video 1 shows a progression through optical sections (from posterior to anterior), and Video 2 shows a 3-dimensional rotating view of this image. C, Sagittal tissue section showing Shh-producing cells (green) and BrdU-labeled proliferative cells (red, 24-h exposure) in the adult hypothalamus. Shh-producing cells are located primarily in the dorsal portions of both the LR and PR. Shh-expressing cells in the LR send projections toward to the dorsal region of the PR. Panels at right show separated fluorescent channels from the boxed regions, with examples of co-labeled cells in both ventricular regions indicated by arrowheads. D, Sagittal tissue section through the LR and PR of a Tg(GBS-ptch2:EGFP) transgenic adult showing Hh-responsive cells and proliferative cells labeled with BrdU (red, 24-h treatment) and the anti-PCNA antibody (magenta). Panels at right show separated channels from the boxed region, with four PCNA+/BrdU+-labeled Hh-responsive cells indicated by yellow asterisks and two PCNA+/BrdU cells indicated by white asterisks. E, Sagittal tissue section through the PR of a Tg(GBS-ptch2:EGFP) transgenic adult labeled with the anti-s100β antibody to show radial glia. Most but not all Hh-responsive cells are s100β-positive (white arrowheads). A small percentage of GFP-labeled cells that are more distant from the ventricle are s100β-negative (yellow arrowhead), suggesting these cells have differentiated but retain GFP fluorescence from previous GBS-ptch2:EGFP transgene expression. F, Transverse tissue section through the PR of the hypothalamus of a Tg(GBS-ptch2:EGFP) adult labeled with the Sox2 antibody that labels neurogenic cells. Most or all Hh-responsive cells express the Sox2 protein. Panels at right show separated channels from the boxed region with arrowheads marking co-labeled cells. G, Sagittal tissue section through the PR of a Tg(GBS-ptch2:EGFP) adult labeled with an antibody to the neuronal marker HuC/D (now called Elavl3). Double labeling of cells far from the ventricle indicates that Hh-responsive cells (green) can give rise to HuC/D-expressing neurons (red). Panels at right show separated channels from the boxed region with co-labeled cells (arrowheads). Cb, cerebellum; hy, hypothalamus; LR, lateral recess of the hypothalamic (third) ventricle; PR, posterior recess of the hypothalamic (third) ventricle; tect, tectum. Scale bars: 1 mm (A), 50 μm (B), and 20 μm (C–H).

Hh pathway gene expression in the larval and adult zebrafish hypothalamus. A–F, Expression of Hh-signaling pathway genes in sectioned tissue from 4-dpf larvae. A, In situ hybridization (ISH) showing that shh is highly expressed in the ventricular regions of the LR and PR of the hypothalamic ventricle, as well as in ventricular regions of the diencephalon/telencephalon border, cerebellum, and tectum. B, The Hh-target gene patched2 is similarly expressed in ventricular regions throughout the larval brain, with ptch2 transcription being eliminated by treatment with Cya (B, inset). C, Shh-producing (green, Shh-prod) and ptch2 (red, Hh-resp) expression in the larval brain as revealed by the Tg(shha:GFP) and Tg(GBS-ptch2:NLS-mCherry) reporter lines, seen here in a double transgenic larva. This midline section reveals Hh response in the midline ventricular region. D–F, ISH showing expression of the Hh-responsive transcription factors gli1, gli2a, and gli3, respectively. G–L, ISH on tissue sections showing expression of Hh signaling pathway genes in the adult hypothalamus. G, shh expression is maintained in the LR and PR of the adult hypothalamic ventricle. H, Expression of the Hh-target gene patched2 in the hypothalamic ventricular regions as revealed by ISH and compared with nuclear mCherry expression in cells of the LR and PR driven by the ptch2 promoter construct in the Tg(GBS-ptch2:NLS-mCherry) transgenic line (inset). I, ISH using a ptch2 probe shows that Cya treatment (bottom panel) of six-month-old adult dramatically reduced ptch2 gene expression in the LR and PR compared with an age-matched DMSO control treated fish (top panel). J–L, ISH showing expression of the Hh-responsive transcription factors gli1, gli2a, and gli3, respectively, in the hypothalamus. All panels show sagittal tissue sections, except L, which shows a transverse tissue section. cb, cerebellum; di, diencephalon; hy, hypothalamus; tect, tectum; tel, telencephalon. Scale bars: 50 μm.

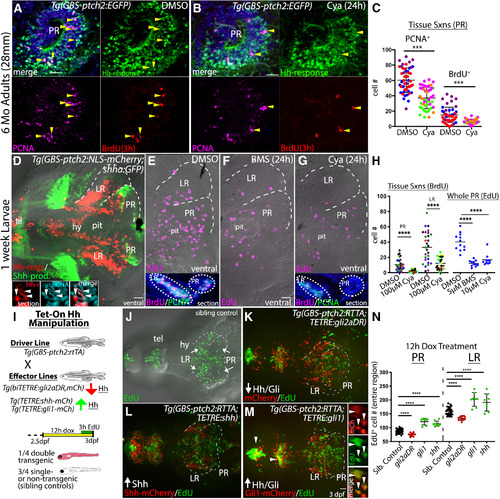
Hh signaling positively regulates proliferation in the adult and larval hypothalamus. A, Sagittal section through the PR of a DMSO (control)-injected Tg(GBS-ptch2:EGFP) transgenic adult brain showing anti-PCNA (magenta)-labeled and BrdU (red, 3-h exposure)-labeled proliferative cells. Arrowheads mark triple-labeled, proliferative, Hh-responsive cells. B, Sagittal section through the PR of a Tg(GBS-ptch2:EGFP) transgenic adult brain 24 h after injection of the Hh/Smo inhibitor Cya (80 μm) showing anti-PCNA (magenta)-labeled and BrdU (red)-labeled proliferative cells. Arrowheads mark triple-labeled cells. C, Quantification of BrdU-labeled and PCNA-labeled cells in control and Cya-injected adults. Each dot represents the number of cells counted in a single tissue section, with each color representing a different adult fish (n = 3 fish, 10–11 sections per fish). D, Ventral view of a dissected Tg(GBS-ptch2:NLS-mCherry;shha:GFP) double transgenic larval brain showing Hh-responsive (red) and Shh-producing (green) cells. The hypothalamic lobes surrounding the PR and LR of the third ventricle are outlined on one side of the brain. Insets show PCNA-labeled (cyan) Hh-responsive cells (red) in sagittal sections through the PR of a different larval brain, with examples of double-labeled cells marked by arrowheads. E–G, Ventral views of 7-dpf larval brains from fish labeled for 3 h with EdU following incubation in DMSO (control, E), BMS-833923 (BMS, F), or Cya (G) for 24 h. Insets in E, G show representative sagittal tissue sections through the hypothalamus of DMSO (E)-treated and Cya (F)-treated larvae labeled to show BrdU (2-h treatment) and PCNA-labeled proliferative cells. H, Quantification of EdU-labeled, BrdU-labeled, and PCNA-labeled cells in the PR and LR. For tissue sections (left), each color represents a different larval fish (n = 5 controls, n = 6 Cya treated), and each dot represents cells in a single tissue section (five to nine sections per fish). For whole PR EdU counts (right), each dot represents one larva (n = 12 for DMSO, 11 for BMS, and 10 for Cya). I, Schematic showing the Tet-On transgenic system used to manipulate Hh signaling. The Tg(GBS-ptch2:RTTA) line drives expression of the RTTA transcriptional activator in Hh-responsive cells, with different effector transgenes allowing upregulation and downregulation of Hh signaling on the addition of doxycycline, which is required for RTTA function. Activation of the two-part transgenic expression system is indicated by mCherry fluorescence in larvae, as shown in the diagram of the experimental timeline. J–M, Ventral views of EdU-labeled (3-h exposure) proliferative cells in the larval hypothalamus following manipulation of Hh signaling levels using the Tet-On system. J, EdU-labeled proliferative cells (green) in a single-transgenic sibling (control), identified based on the lack of red fluorescence. K, EdU-labeled proliferative cells (green) visualized 12 h after activation of a dominant repressor form of the Gli2 transcription factor (Gli2DR) in Hh-responsive cells (red). L, EdU-labeled proliferative cells (green) visualized following activation of the Shh effector transgene [Tg(TETRE:shha-mCherry)] in Hh-responsive cells [Tg(GBS-ptch2:RTTA) driver]. M, EdU-labeled proliferative cells 12 h after activation of the Gli1-mCherry fusion protein in Hh-responsive cells (red). A subset of EdU-labeled cells was co-labeled with the mCherry protein (arrowheads). Separated EdU, mCherry, and merged channels from the PR of a different brain are shown on the right. N, Quantification of all EdU+ proliferating cells in the PR and LR of the larval hypothalamus following Hh-manipulation using the Tet-On system. Each dot represents an individual fish. Upregulation of Hh/Gli signaling via the shha and gli1 transgenes led to increased proliferation, while downregulation of Hh signaling via the gli2DR transgene reduced proliferation; ***p < 0.001, ****p < 0.0001. Source data for graphs can be found in Extended Data Figure 3-1. Scale bars: 20 μm.

Cya and BMS-833923 both block Hh signaling in zebrafish larvae. A–I, Lateral views of the trunk of TgBAC(ptch2:Kaede) larvae showing Kaede expression in Hh-responsive cells of the ventral spinal cord at different time points after UV photoconversion. Smaller panels show separated color channels. A, D, G, The border of native (green) and photoconverted (red) Kaede protein in the spinal cord immediately after photoconversion of the anterior trunk region. B, C, In DMSO-treated control larvae newly synthesized Kaede protein (arrowheads) was easily detectable after 24 h and continued to increase through 48 and 72 h, when converted and non-converted protein levels were very roughly equivalent (C, inset). E, F, Treatment with 5 μm BMS-833923 effectively blocked the synthesis of new Kaede protein (arrowheads) in the ventral spinal cord at 24 h (E), with low levels of newly synthesized Kaede protein becoming visible after 48 h at this drug concentration (F). H, I, Treatment with 10 μm Cya effectively blocked new Kaede synthesis (arrowheads) for 24 h (H), with low levels of expression being visible after 48 h at this low Cya concentration (I).

Blocking Hh signaling with Cya reduces cyclinD1 expression in the hypothalamus but does not increase hypothalamic cell death. A, Sagittal section through a 6-dpf larval brain showing cyclinD1 mRNA expression in the ventricular regions of the hypothalamus (dashed-square), telencephalon (tel), and dorsal tectum (arrows). B, cyclinD1 is expression is eliminated in the LR and PR of the hypothalamus (arrowheads) following 12 h of Cya exposure but is largely unaffected in the tectum (arrows). C, Cell death in a DMSO-treated control larva as revealed by anti-phospho-Caspase3 antibody labeling. D, Two-day Cya treatment did not lead to increased cell death in the hypothalamus, although increased cell death was seen in the tectum (arrows). cb, cerebellum; tect, tectum; tel, telencephalon. Scale bars: 50 μm.

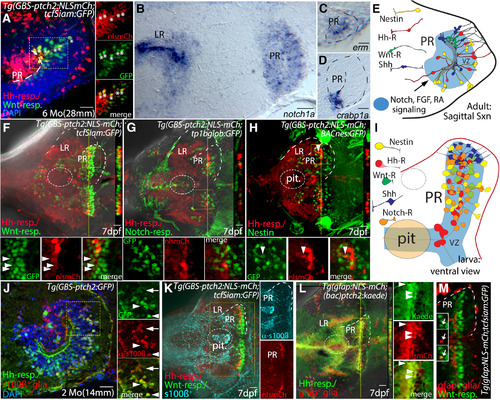
Hh, Wnt, Notch, FGF, and retinoic acid signaling in a complex hypothalamic neurogenic niche. A, Sagittal section through the PR of a Tg(GBS-ptch2:NLS-mCherry;TCFSiam:GFP) double transgenic adult. Hh-responsive cells (red) of the PR are largely distinct from Wnt-responsive cells (green); however, a subset of cells in the dorsal PR contains both GFP and mCherry (asterisks). Panels at right show separated channels from the boxed region. B, Sagittal section through the hypothalamus showing notch1a expression in the LR and PR, as visualized by in situ hybridization. C, D, Sagittal section through the PR showing expression of the FGF target gene erm (Raible and Brand, 2001) and the retinoic acid binding protein gene crabp1a (Liu et al., 2005). E, Schematic of cell-cell signaling systems of the PR, including four distinct radial glial types that are defined by reporter gene expression (see Figs. 1-3 for data used to draw Shh-expressing and nestin-expressing cells). F–H, Ventral views of the 7-dpf hypothalamus of double transgenic larvae. Dotted lines outline the ventricular regions of LR and PR, and cut views at right show optical Z-sections through the PR at the position of the yellow dotted line. F, Larval Hh-responsive cells of the PR are distinct from Wnt-responsive cells, as revealed in Tg(GBS-ptch2:NLS-mCherry;TCFSiam:GFP) double transgenic larva. G, Hh-responsive and Notch-responsive cells of the PR are also distinct, as revealed in Tg(GBS-ptch2:NLS-mCherry;tp1bglob:GFP) double transgenic larva. H, Hh-responsive cells of the PR are distinct from nestin-expressing cells, as revealed in Tg(GBS-ptch2:NLS-mCherry;nes:EGFP) double transgenic larva. I, Schematic ventral view of the larval hypothalamus showing cell-signaling pathways examined and four distinct radial glial types, as defined by gene expression in fluorescent reporter lines. Note that the data do not rule out the possibility that subsets of different signal-responsive cells may overlap both spatially and temporally. J, Sagittal section through the PR of a Tg(GBS-ptch2:GFP) adult labeled with the anti-s100β antibody. A total of 482 of 633 (76%) s100β-expressing cells were Hh responsive based on double labeling (arrowheads), while 482 of 533 (90%) of Hh-responsive cells co-labeled with the s100β antibody (n = 6 sections from 2 brains). Weakly labeled S100β cells tended to correspond to the more weakly fluorescent GFP+ cells (arrows). K, In 7-dpf larvae, S100β was only weakly expressed in the PR, despite strong expression in other regions of the brain and pituitary (ventral view). L, Ventral view of a Tg(gfap:NLS-mCherry;GBS-ptch2:kaede) double transgenic larva. A total of 176 of 474 (37%) of gfap-expressing cells counted were Hh responsive based on Kaede expression (arrowheads). Conversely, 176 of 463 (35%) Hh-R cells counted expressed the gfap transgene (n = 10 larvae). M, Ventral view of a Tg(gfap:NLS-mCherry;tcfsiam:GFP) double transgenic larva. Only 12 of 572 (2%) Wnt-R cells examined expressed the gfap transgene (insets, arrows; n = 10 embryos). pit, pituitary. Scale bars: 20 μm.

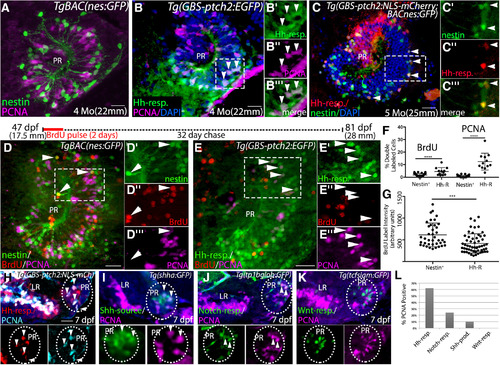
Hh-responsive cells are more highly proliferative than other radial glia in the hypothalamus. A, Sagittal tissue section through the PR of a TgBAC(nes:EGFP) transgenic adult brain showing PCNA antibody-labeled proliferative cells. Nestin-expressing cells are predominantly PCNA negative. B, Sagittal tissue section through the PR of a Tg(ptch2:EGFP) transgenic adult brain showing PCNA antibody labeled proliferative cells. Arrowheads indicate examples of PCNA-labeled (proliferative) Hh-responsive cells. Panels at right show separated channels from the boxed region. C, Hh-responsive cells (red) are largely distinct from Nestin-expressing cells (green) in the PR of the adult hypothalamus, as visualized in Tg(GBS-ptch2:NLS-mCherry;nes:EGFP) double transgenic fish. However, 17% of cells (74 cells of 442 total) contained both GFP and mCherry (arrowheads, n = 9 tissue sections from 3 double transgenic fish) with GFP fluorescence substantially lower in double-labeled cells. Panels at right show separated channels from the boxed region. D, E, BrdU pulse-chase experiment. Schematic above panels shows timing of pulse and chase, with 47-dpf adult TgBAC(nes:EGFP) or Tg(GBS-ptch2:EGFP) fish being exposed to 10 μm BrdU in fish water for 2 d; 32 d later fish were killed, and tissue sections were labeled using anti-BrdU (red) and anti-PCNA (magenta) antibodies. D, Representative sagittal section through the PR of a TgBAC(nes:EGFP) adult, insets show single channel data for the boxed region. A small number of Nestin-expressing cells in the PR retained the BrdU label after one month. These cells did not express PCNA (arrowheads), indicating they were not in G1/S/G2 of the cell cycle at the time of fixation. E, Representative sagittal section through the PR of a Tg(GBS-ptch2:EGFP) adult, insets show single channel data for the boxed region. Most Hh-responsive cells failed to retain the BrdU label after one month, and many of these cells expressed PCNA (arrowheads), indicating active cell cycling at the time of fixation. F, Graph showing the percentage of Nestin-expressing or Hh-responsive cells that co-labeled with the BrdU or PCNA antibodies. Tg(nesGFP): n = 3 fish, 13–16 tissue sections per fish. Tg(GBS-ptch2:EGFP): n = 2 fish, 13–16 sections per fish. G, Quantification of BrdU label intensity in Nestin-expressing and Hh-responsive cells showing BrdU labeling intensity was significantly lower in Hh-responsive cells compared with nestin-expressing cells. H–K, Representative images of PCNA labeling in single confocal optical sections from sagittal sections through the hypothalamus in 7-dpf larvae expressing four different transgenes. Top panels show merged images (transgene reporter + PCNA + DAPI) and bottom panels show single channels. H, In Tg(GBS-ptch2:NLS-mCh) larvae over 60% of NLS-mCherry-expressing cells in the hypothalamic ventricular regions are labeled with the PCNA antibody (arrowheads). In the LR, 214 of 288 NLS-mCherry+ cells labeled with PCNA (74%), while in the PR 110 of 117 (62%) cells were double labeled (n = 12 sections from 3 larvae). I, Shh producing cells were predominantly found in the PR (dotted oval); 19 of 186 GFP+ cells expressed PCNA (10%, arrowheads; n = 15 sections from 3 larvae). J, Notch responsive cells, as revealed in the Tg(Tp1bglob:GFP) line, were also localized to the PR (oval); 27 of 113 GFP+ cells were PCNA+ (24%, arrowheads; n = 11 sections from 3 larvae). K, Wnt-responsive cells are confined to the PR (oval). None of the 266 cells examined expressed PCNA (n = 18 sections from 3 larvae). L, Graph showing the percentage of each transgene-expressing cell type found to also express PCNA; ***p < 0.001, ****p < 0.0001. Source data for graphs can be found in Extended Data Figure 7-1. All panels show 0.5-μm single optical sections of 20-μm tissue sections. Scale bars: 20 μm.

Hh-responsive progenitors of the hypothalamus give rise to dopaminergic, serotonergic, and GABAergic neurons. A, Native (green) Kaede expression in Hh-responsive hypothalamic cells at 9 dpf, as seen in a non-UV-irradiated brain. B, Photoconverted (red) Kaede expression in hypothalamic Hh-responsive cells as seen in the brain from a fish that had been exposed to UV light for 10 min before fixation. C, Kaede expression in the hypothalamus of a fish that had been UV-irradiated 3 d before fixation and imaging. The majority of native/newly produced Kaede protein (green) is seen in the ventricular regions (e.g., inside dotted oval), consistent with continued Hh-target gene expression in proliferative cells. UV-converted Kaede protein (red) is still visible in the ventricular regions 3 d after conversion but is also present in cells more distant from the ventricle that do not contain new/native Kaede protein (arrowheads). Panels at bottom show merged and separated red and green channels as indicated. D, Dopaminergic cells and Hh-responsive cells in the ventral brain, as visualized in a Tg(slc6a3:EGFP,GBS-ptch2:NLS-mCherry) double transgenic larva. A small subset of cells expresses both the GFP and the NLS-mCherry proteins (arrowheads, circle), suggesting Hh-responsive cells can give rise to dopaminergic neurons. E, Monoaminergic neurons and Hh-responsive cells as visualized in a Tg(slc18a2:GFP,GBS-ptch2:NLS-mCherry) double transgenic larva. Again, a small subset of cells expresses both the GFP and the NLS-mCherry proteins (arrowheads), suggesting Hh-responsive cells can give rise to monoaminergic neurons. F, GABAergic neurons and Hh-responsive cells as visualized in a TgBAC(gad1b:GFP, GBS-ptch2:NLS-mCherry) double transgenic larva. A small subset of cells expresses both the GFP and the NLS-mCherry proteins (arrowheads), suggesting Hh-responsive cells can give rise to GABAergic neurons. G, Antibody labeling in a Tg(GBS-ptch2:NLS-mCherry) larval brain showing serotonin (5-HT) expression in the ventral hypothalamus. The presence of double-labeled cells is consistent with Hh-responsive cells giving rise to serotonergic neurons. H, I, Ventral views of anti-serotonin antibody labeled 7-dpf larval brains labeled cells following conditional manipulation of Hh signaling using the Tet-On transgenic system. H, Representative single transgenic [Tg(GBS-ptch2:RTTA-HA) or Tg(TETRE:shha-mCherry)] sibling larva, identified by the lack of mCherry expression, showing number of serotonergic cells in the absence of effector transgene activation. I, Representative Tg(GBS-ptch2:RTTA,TETRE:shha-mCherry) double transgenic larva, identified by mCherry expression, showing increased numbers of serotonergic cells in the PR following 2 d activation of the shha-mCherry transgene. J, Representative Tg(GBS-ptch2:RTTA,biTETRE:gli2aDR,NLS-mCherry) double transgenic larva, identified by mCherry expression, showing decreased numbers of serotonergic cells in the PR following 2 d activation of the gli2DR transgene. K, Graph showing serotonergic cell numbers, at 5–7 dpf following 1 or 2 d activation of the Tet-On system in doxycycline (see diagram at top of graph). Error bars indicate SD. Sample numbers for each experimental condition are shown on the graph, with significance determined using a one-way ANOVA; *p < 0.05, ***p < 0.001, ****p < 0.0001. Source data for graphs can be found in Extended Data Figure 8-1. A–J, Ventral views of dissected brains from 7-dpf larvae to show the hypothalamus. Dotted lines outline LR and PR on half of the brain. Small panels at right in A–D show single channel data for a single optical section in the boxed regions. hyp, hypothalamus; tel, telencephalon. Scale bars: 20 μm.

Acknowledgments
This image is the copyrighted work of the attributed author or publisher, and ZFIN has permission only to display this image to its users. Additional permissions should be obtained from the applicable author or publisher of the image. Full text @ eNeuro